Chippewa vs Salvadoran Unemployment Among Women with Children Ages 6 to 17 years
COMPARE
Chippewa
Salvadoran
Unemployment Among Women with Children Ages 6 to 17 years
Unemployment Among Women with Children Ages 6 to 17 years Comparison
Chippewa
Salvadorans
11.1%
UNEMPLOYMENT AMONG WOMEN WITH CHILDREN AGES 6 TO 17 YEARS
0.0/ 100
METRIC RATING
330th/ 347
METRIC RANK
9.2%
UNEMPLOYMENT AMONG WOMEN WITH CHILDREN AGES 6 TO 17 YEARS
10.7/ 100
METRIC RATING
209th/ 347
METRIC RANK
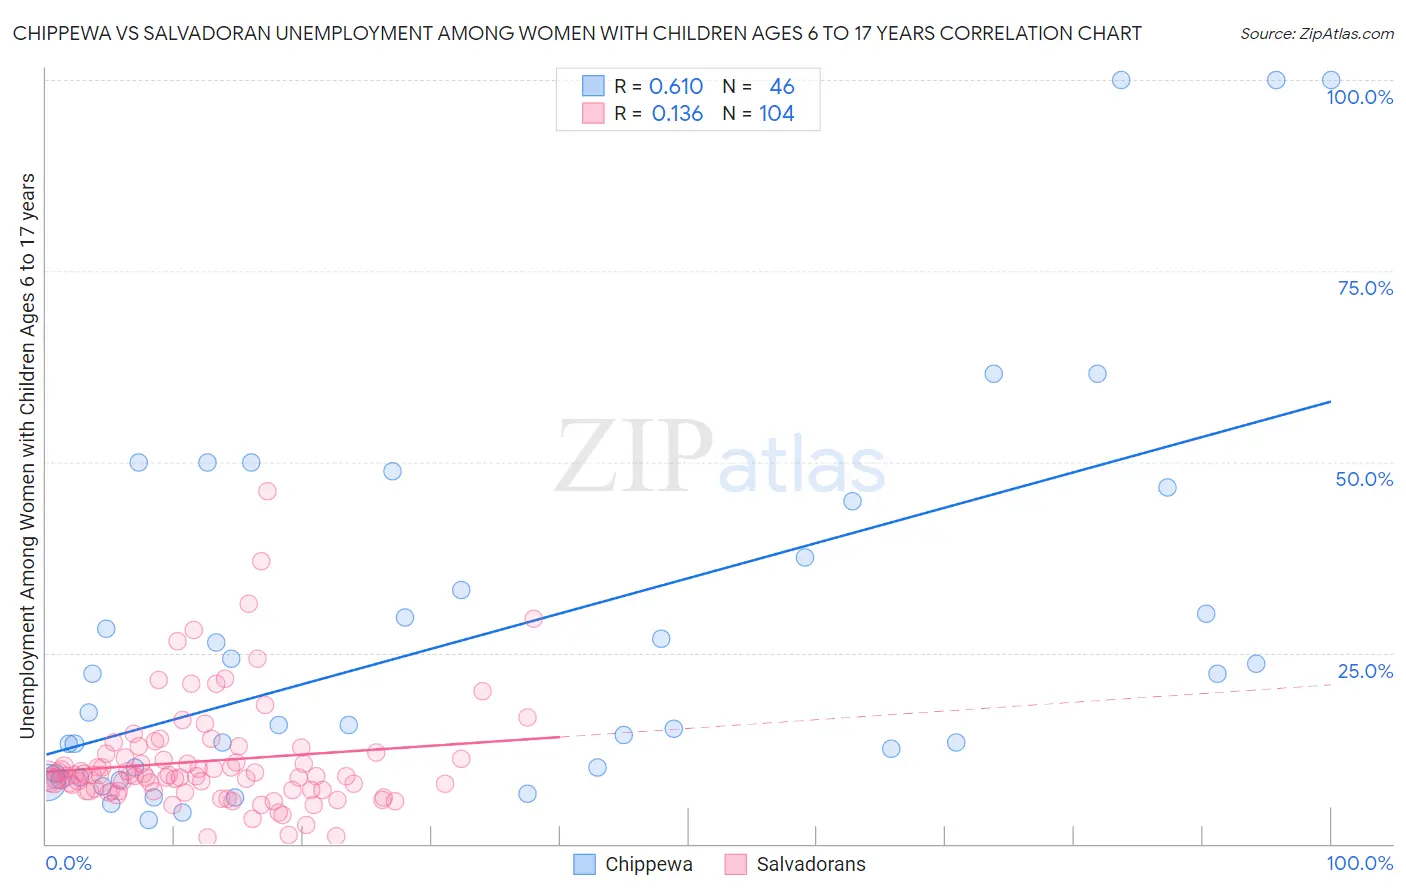
Chippewa vs Salvadoran Unemployment Among Women with Children Ages 6 to 17 years Correlation Chart
The statistical analysis conducted on geographies consisting of 165,586,113 people shows a significant positive correlation between the proportion of Chippewa and unemployment rate among women with children between the ages 6 and 17 in the United States with a correlation coefficient (R) of 0.610 and weighted average of 11.1%. Similarly, the statistical analysis conducted on geographies consisting of 294,326,851 people shows a poor positive correlation between the proportion of Salvadorans and unemployment rate among women with children between the ages 6 and 17 in the United States with a correlation coefficient (R) of 0.136 and weighted average of 9.2%, a difference of 20.8%.
Unemployment Among Women with Children Ages 6 to 17 years Correlation Summary
| Measurement | Chippewa | Salvadoran |
| Minimum | 3.1% | 0.90% |
| Maximum | 100.0% | 46.2% |
| Range | 96.9% | 45.3% |
| Mean | 27.4% | 10.8% |
| Median | 16.4% | 8.9% |
| Interquartile 25% (IQ1) | 9.2% | 7.0% |
| Interquartile 75% (IQ3) | 37.5% | 11.5% |
| Interquartile Range (IQR) | 28.3% | 4.5% |
| Standard Deviation (Sample) | 25.2% | 7.2% |
| Standard Deviation (Population) | 24.9% | 7.1% |
Similar Demographics by Unemployment Among Women with Children Ages 6 to 17 years
Demographics Similar to Chippewa by Unemployment Among Women with Children Ages 6 to 17 years
In terms of unemployment among women with children ages 6 to 17 years, the demographic groups most similar to Chippewa are Pennsylvania German (11.0%, a difference of 0.48%), Ottawa (10.9%, a difference of 2.0%), Cape Verdean (10.9%, a difference of 2.1%), Liberian (10.8%, a difference of 2.2%), and Cajun (10.8%, a difference of 2.2%).
| Demographics | Rating | Rank | Unemployment Among Women with Children Ages 6 to 17 years |
| Dominicans | 0.0 /100 | #323 | Tragic 10.8% |
| Immigrants | Dominican Republic | 0.0 /100 | #324 | Tragic 10.8% |
| Cajuns | 0.0 /100 | #325 | Tragic 10.8% |
| Liberians | 0.0 /100 | #326 | Tragic 10.8% |
| Cape Verdeans | 0.0 /100 | #327 | Tragic 10.9% |
| Ottawa | 0.0 /100 | #328 | Tragic 10.9% |
| Pennsylvania Germans | 0.0 /100 | #329 | Tragic 11.0% |
| Chippewa | 0.0 /100 | #330 | Tragic 11.1% |
| Blacks/African Americans | 0.0 /100 | #331 | Tragic 11.4% |
| Tsimshian | 0.0 /100 | #332 | Tragic 11.4% |
| Natives/Alaskans | 0.0 /100 | #333 | Tragic 11.5% |
| Ugandans | 0.0 /100 | #334 | Tragic 12.0% |
| Colville | 0.0 /100 | #335 | Tragic 12.3% |
| Houma | 0.0 /100 | #336 | Tragic 12.5% |
| Immigrants | Yemen | 0.0 /100 | #337 | Tragic 12.7% |
Demographics Similar to Salvadorans by Unemployment Among Women with Children Ages 6 to 17 years
In terms of unemployment among women with children ages 6 to 17 years, the demographic groups most similar to Salvadorans are Cuban (9.2%, a difference of 0.010%), Immigrants from Peru (9.2%, a difference of 0.010%), Finnish (9.2%, a difference of 0.090%), Immigrants from Cuba (9.2%, a difference of 0.14%), and Immigrants from North America (9.2%, a difference of 0.21%).
| Demographics | Rating | Rank | Unemployment Among Women with Children Ages 6 to 17 years |
| Immigrants | Middle Africa | 15.6 /100 | #202 | Poor 9.1% |
| Maltese | 15.3 /100 | #203 | Poor 9.1% |
| Immigrants | Canada | 15.3 /100 | #204 | Poor 9.1% |
| Immigrants | Western Europe | 14.1 /100 | #205 | Poor 9.1% |
| Immigrants | North America | 12.7 /100 | #206 | Poor 9.2% |
| Cubans | 10.9 /100 | #207 | Poor 9.2% |
| Immigrants | Peru | 10.8 /100 | #208 | Poor 9.2% |
| Salvadorans | 10.7 /100 | #209 | Poor 9.2% |
| Finns | 10.0 /100 | #210 | Tragic 9.2% |
| Immigrants | Cuba | 9.6 /100 | #211 | Tragic 9.2% |
| Peruvians | 9.0 /100 | #212 | Tragic 9.2% |
| Spaniards | 8.2 /100 | #213 | Tragic 9.2% |
| Iroquois | 7.5 /100 | #214 | Tragic 9.2% |
| Immigrants | Germany | 7.2 /100 | #215 | Tragic 9.2% |
| Immigrants | Uruguay | 7.2 /100 | #216 | Tragic 9.2% |