Chinese vs Iraqi Unemployment Among Ages 60 to 64 years
COMPARE
Chinese
Iraqi
Unemployment Among Ages 60 to 64 years
Unemployment Among Ages 60 to 64 years Comparison
Chinese
Iraqis
4.0%
UNEMPLOYMENT AMONG AGES 60 TO 64 YEARS
100.0/ 100
METRIC RATING
3rd/ 347
METRIC RANK
4.5%
UNEMPLOYMENT AMONG AGES 60 TO 64 YEARS
100.0/ 100
METRIC RATING
39th/ 347
METRIC RANK
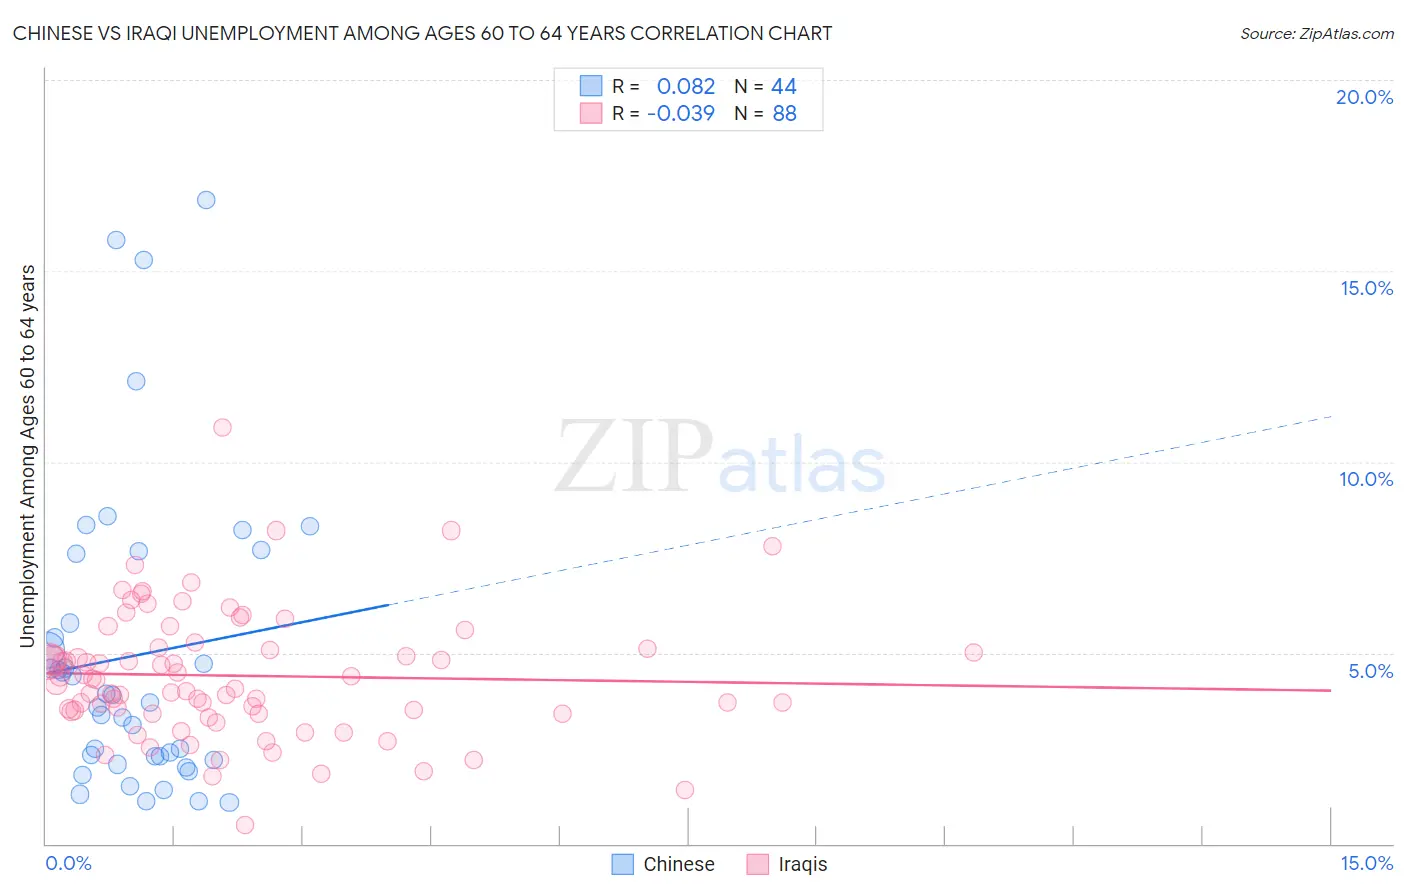
Chinese vs Iraqi Unemployment Among Ages 60 to 64 years Correlation Chart
The statistical analysis conducted on geographies consisting of 62,952,421 people shows a slight positive correlation between the proportion of Chinese and unemployment rate among population between the ages 60 and 64 in the United States with a correlation coefficient (R) of 0.082 and weighted average of 4.0%. Similarly, the statistical analysis conducted on geographies consisting of 163,668,618 people shows no correlation between the proportion of Iraqis and unemployment rate among population between the ages 60 and 64 in the United States with a correlation coefficient (R) of -0.039 and weighted average of 4.5%, a difference of 12.5%.
Unemployment Among Ages 60 to 64 years Correlation Summary
| Measurement | Chinese | Iraqi |
| Minimum | 1.1% | 0.50% |
| Maximum | 16.9% | 10.9% |
| Range | 15.8% | 10.4% |
| Mean | 4.9% | 4.4% |
| Median | 3.8% | 4.2% |
| Interquartile 25% (IQ1) | 2.2% | 3.4% |
| Interquartile 75% (IQ3) | 6.7% | 5.1% |
| Interquartile Range (IQR) | 4.4% | 1.7% |
| Standard Deviation (Sample) | 3.9% | 1.7% |
| Standard Deviation (Population) | 3.9% | 1.7% |
Similar Demographics by Unemployment Among Ages 60 to 64 years
Demographics Similar to Chinese by Unemployment Among Ages 60 to 64 years
In terms of unemployment among ages 60 to 64 years, the demographic groups most similar to Chinese are Hmong (4.0%, a difference of 0.42%), Immigrants from the Azores (4.0%, a difference of 0.43%), Fijian (3.9%, a difference of 2.9%), Immigrants from Congo (4.1%, a difference of 3.2%), and Lumbee (4.2%, a difference of 4.1%).
| Demographics | Rating | Rank | Unemployment Among Ages 60 to 64 years |
| Marshallese | 100.0 /100 | #1 | Exceptional 3.7% |
| Fijians | 100.0 /100 | #2 | Exceptional 3.9% |
| Chinese | 100.0 /100 | #3 | Exceptional 4.0% |
| Hmong | 100.0 /100 | #4 | Exceptional 4.0% |
| Immigrants | Azores | 100.0 /100 | #5 | Exceptional 4.0% |
| Immigrants | Congo | 100.0 /100 | #6 | Exceptional 4.1% |
| Lumbee | 100.0 /100 | #7 | Exceptional 4.2% |
| Immigrants | Micronesia | 100.0 /100 | #8 | Exceptional 4.2% |
| Indonesians | 100.0 /100 | #9 | Exceptional 4.2% |
| Immigrants | Bosnia and Herzegovina | 100.0 /100 | #10 | Exceptional 4.2% |
| Luxembourgers | 100.0 /100 | #11 | Exceptional 4.3% |
| Immigrants | Cuba | 100.0 /100 | #12 | Exceptional 4.3% |
| Chickasaw | 100.0 /100 | #13 | Exceptional 4.3% |
| Norwegians | 100.0 /100 | #14 | Exceptional 4.3% |
| Sudanese | 100.0 /100 | #15 | Exceptional 4.3% |
Demographics Similar to Iraqis by Unemployment Among Ages 60 to 64 years
In terms of unemployment among ages 60 to 64 years, the demographic groups most similar to Iraqis are Native Hawaiian (4.5%, a difference of 0.0%), Scandinavian (4.5%, a difference of 0.15%), Immigrants from Portugal (4.5%, a difference of 0.20%), Venezuelan (4.5%, a difference of 0.23%), and German (4.5%, a difference of 0.24%).
| Demographics | Rating | Rank | Unemployment Among Ages 60 to 64 years |
| Zimbabweans | 100.0 /100 | #32 | Exceptional 4.5% |
| Carpatho Rusyns | 100.0 /100 | #33 | Exceptional 4.5% |
| Belgians | 100.0 /100 | #34 | Exceptional 4.5% |
| Germans | 100.0 /100 | #35 | Exceptional 4.5% |
| Venezuelans | 100.0 /100 | #36 | Exceptional 4.5% |
| Immigrants | Portugal | 100.0 /100 | #37 | Exceptional 4.5% |
| Native Hawaiians | 100.0 /100 | #38 | Exceptional 4.5% |
| Iraqis | 100.0 /100 | #39 | Exceptional 4.5% |
| Scandinavians | 100.0 /100 | #40 | Exceptional 4.5% |
| Immigrants | Sudan | 100.0 /100 | #41 | Exceptional 4.5% |
| English | 100.0 /100 | #42 | Exceptional 4.5% |
| Swedes | 100.0 /100 | #43 | Exceptional 4.5% |
| Europeans | 100.0 /100 | #44 | Exceptional 4.5% |
| Liberians | 99.9 /100 | #45 | Exceptional 4.5% |
| Bhutanese | 99.9 /100 | #46 | Exceptional 4.5% |