Chinese vs Albanian Unemployment Among Ages 60 to 64 years
COMPARE
Chinese
Albanian
Unemployment Among Ages 60 to 64 years
Unemployment Among Ages 60 to 64 years Comparison
Chinese
Albanians
4.0%
UNEMPLOYMENT AMONG AGES 60 TO 64 YEARS
100.0/ 100
METRIC RATING
3rd/ 347
METRIC RANK
4.7%
UNEMPLOYMENT AMONG AGES 60 TO 64 YEARS
95.3/ 100
METRIC RATING
121st/ 347
METRIC RANK
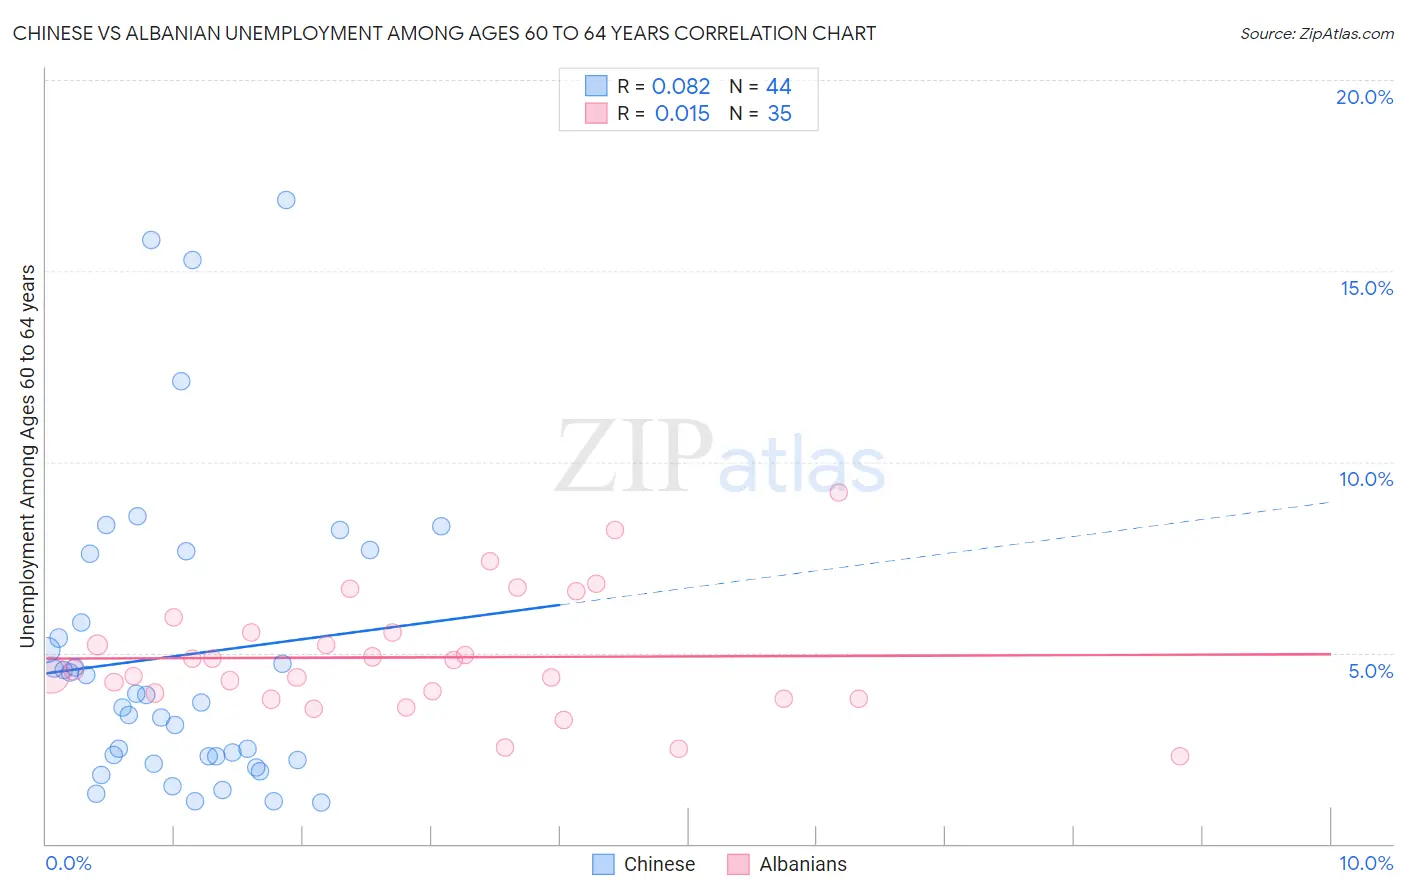
Chinese vs Albanian Unemployment Among Ages 60 to 64 years Correlation Chart
The statistical analysis conducted on geographies consisting of 62,952,421 people shows a slight positive correlation between the proportion of Chinese and unemployment rate among population between the ages 60 and 64 in the United States with a correlation coefficient (R) of 0.082 and weighted average of 4.0%. Similarly, the statistical analysis conducted on geographies consisting of 182,876,519 people shows no correlation between the proportion of Albanians and unemployment rate among population between the ages 60 and 64 in the United States with a correlation coefficient (R) of 0.015 and weighted average of 4.7%, a difference of 18.2%.
Unemployment Among Ages 60 to 64 years Correlation Summary
| Measurement | Chinese | Albanian |
| Minimum | 1.1% | 2.3% |
| Maximum | 16.9% | 9.2% |
| Range | 15.8% | 6.9% |
| Mean | 4.9% | 4.9% |
| Median | 3.8% | 4.6% |
| Interquartile 25% (IQ1) | 2.2% | 3.8% |
| Interquartile 75% (IQ3) | 6.7% | 5.5% |
| Interquartile Range (IQR) | 4.4% | 1.7% |
| Standard Deviation (Sample) | 3.9% | 1.6% |
| Standard Deviation (Population) | 3.9% | 1.5% |
Similar Demographics by Unemployment Among Ages 60 to 64 years
Demographics Similar to Chinese by Unemployment Among Ages 60 to 64 years
In terms of unemployment among ages 60 to 64 years, the demographic groups most similar to Chinese are Hmong (4.0%, a difference of 0.42%), Immigrants from the Azores (4.0%, a difference of 0.43%), Fijian (3.9%, a difference of 2.9%), Immigrants from Congo (4.1%, a difference of 3.2%), and Lumbee (4.2%, a difference of 4.1%).
| Demographics | Rating | Rank | Unemployment Among Ages 60 to 64 years |
| Marshallese | 100.0 /100 | #1 | Exceptional 3.7% |
| Fijians | 100.0 /100 | #2 | Exceptional 3.9% |
| Chinese | 100.0 /100 | #3 | Exceptional 4.0% |
| Hmong | 100.0 /100 | #4 | Exceptional 4.0% |
| Immigrants | Azores | 100.0 /100 | #5 | Exceptional 4.0% |
| Immigrants | Congo | 100.0 /100 | #6 | Exceptional 4.1% |
| Lumbee | 100.0 /100 | #7 | Exceptional 4.2% |
| Immigrants | Micronesia | 100.0 /100 | #8 | Exceptional 4.2% |
| Indonesians | 100.0 /100 | #9 | Exceptional 4.2% |
| Immigrants | Bosnia and Herzegovina | 100.0 /100 | #10 | Exceptional 4.2% |
| Luxembourgers | 100.0 /100 | #11 | Exceptional 4.3% |
| Immigrants | Cuba | 100.0 /100 | #12 | Exceptional 4.3% |
| Chickasaw | 100.0 /100 | #13 | Exceptional 4.3% |
| Norwegians | 100.0 /100 | #14 | Exceptional 4.3% |
| Sudanese | 100.0 /100 | #15 | Exceptional 4.3% |
Demographics Similar to Albanians by Unemployment Among Ages 60 to 64 years
In terms of unemployment among ages 60 to 64 years, the demographic groups most similar to Albanians are Immigrants from Kazakhstan (4.7%, a difference of 0.030%), Macedonian (4.7%, a difference of 0.080%), Immigrants from Morocco (4.7%, a difference of 0.090%), Finnish (4.7%, a difference of 0.11%), and Immigrants from Senegal (4.7%, a difference of 0.14%).
| Demographics | Rating | Rank | Unemployment Among Ages 60 to 64 years |
| Maltese | 96.5 /100 | #114 | Exceptional 4.7% |
| Immigrants | Romania | 96.4 /100 | #115 | Exceptional 4.7% |
| Immigrants | England | 96.3 /100 | #116 | Exceptional 4.7% |
| Immigrants | Germany | 96.3 /100 | #117 | Exceptional 4.7% |
| Ukrainians | 96.1 /100 | #118 | Exceptional 4.7% |
| Immigrants | Morocco | 95.7 /100 | #119 | Exceptional 4.7% |
| Macedonians | 95.7 /100 | #120 | Exceptional 4.7% |
| Albanians | 95.3 /100 | #121 | Exceptional 4.7% |
| Immigrants | Kazakhstan | 95.1 /100 | #122 | Exceptional 4.7% |
| Finns | 94.7 /100 | #123 | Exceptional 4.7% |
| Immigrants | Senegal | 94.5 /100 | #124 | Exceptional 4.7% |
| Immigrants | Thailand | 93.7 /100 | #125 | Exceptional 4.7% |
| Immigrants | South Central Asia | 93.0 /100 | #126 | Exceptional 4.7% |
| Austrians | 91.9 /100 | #127 | Exceptional 4.8% |
| Choctaw | 90.3 /100 | #128 | Exceptional 4.8% |