Immigrants from Sierra Leone vs British West Indian Unemployment Among Ages 65 to 74 years
COMPARE
Immigrants from Sierra Leone
British West Indian
Unemployment Among Ages 65 to 74 years
Unemployment Among Ages 65 to 74 years Comparison
Immigrants from Sierra Leone
British West Indians
5.7%
UNEMPLOYMENT AMONG AGES 65 TO 74 YEARS
0.1/ 100
METRIC RATING
285th/ 347
METRIC RANK
5.8%
UNEMPLOYMENT AMONG AGES 65 TO 74 YEARS
0.0/ 100
METRIC RATING
307th/ 347
METRIC RANK
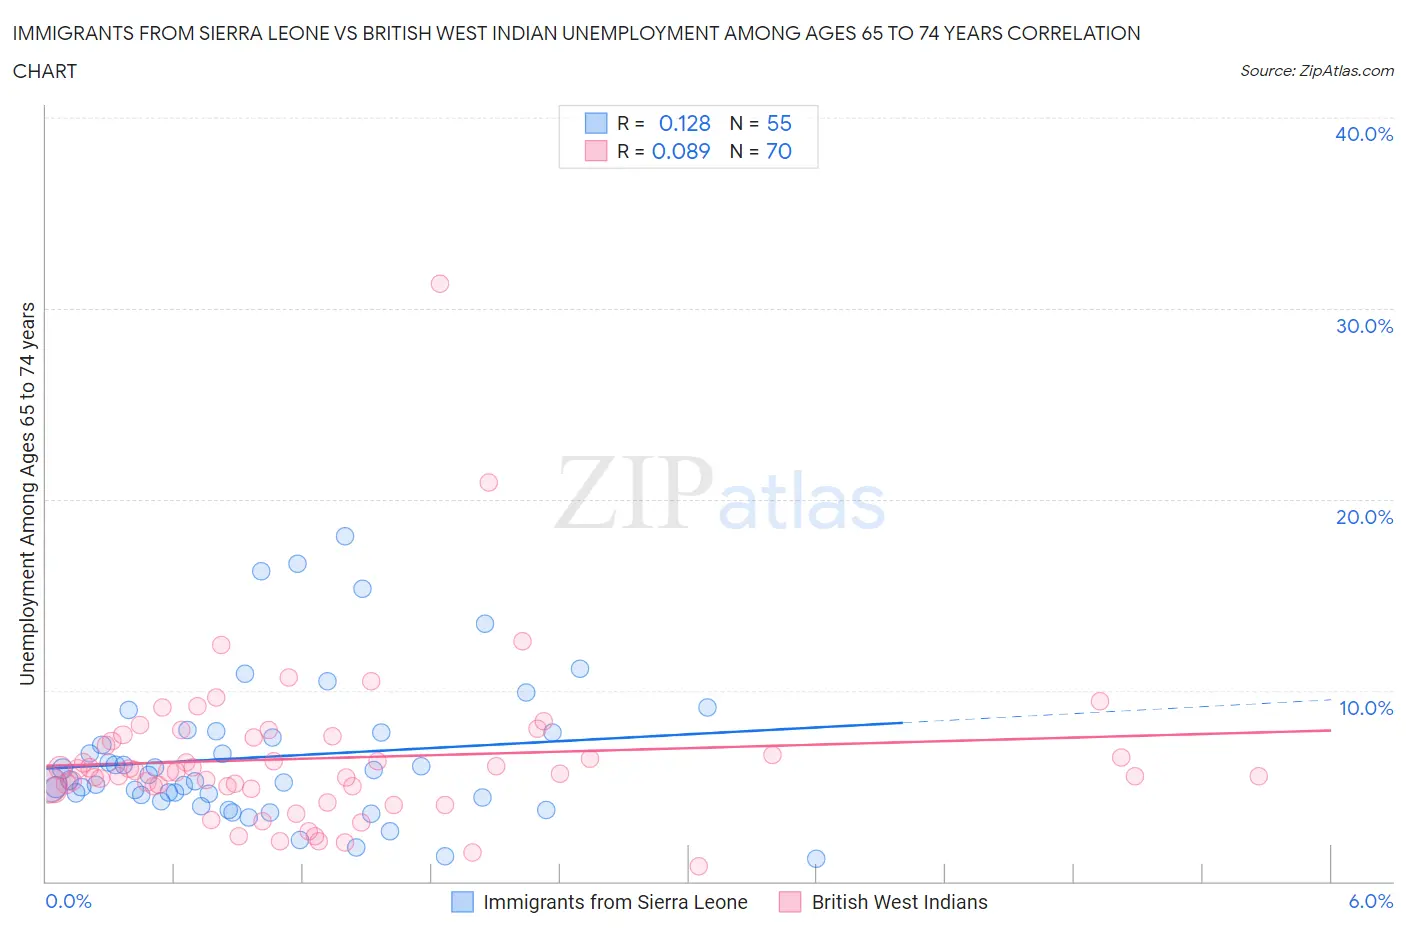
Immigrants from Sierra Leone vs British West Indian Unemployment Among Ages 65 to 74 years Correlation Chart
The statistical analysis conducted on geographies consisting of 97,887,994 people shows a poor positive correlation between the proportion of Immigrants from Sierra Leone and unemployment rate among population between the ages 65 and 74 in the United States with a correlation coefficient (R) of 0.128 and weighted average of 5.7%. Similarly, the statistical analysis conducted on geographies consisting of 144,276,982 people shows a slight positive correlation between the proportion of British West Indians and unemployment rate among population between the ages 65 and 74 in the United States with a correlation coefficient (R) of 0.089 and weighted average of 5.8%, a difference of 2.4%.
Unemployment Among Ages 65 to 74 years Correlation Summary
| Measurement | Immigrants from Sierra Leone | British West Indian |
| Minimum | 1.2% | 0.80% |
| Maximum | 18.1% | 31.3% |
| Range | 16.9% | 30.5% |
| Mean | 6.5% | 6.4% |
| Median | 5.3% | 5.8% |
| Interquartile 25% (IQ1) | 4.4% | 5.0% |
| Interquartile 75% (IQ3) | 7.8% | 7.5% |
| Interquartile Range (IQR) | 3.4% | 2.6% |
| Standard Deviation (Sample) | 3.8% | 4.2% |
| Standard Deviation (Population) | 3.7% | 4.2% |
Similar Demographics by Unemployment Among Ages 65 to 74 years
Demographics Similar to Immigrants from Sierra Leone by Unemployment Among Ages 65 to 74 years
In terms of unemployment among ages 65 to 74 years, the demographic groups most similar to Immigrants from Sierra Leone are Marshallese (5.7%, a difference of 0.030%), Chippewa (5.7%, a difference of 0.050%), Cypriot (5.7%, a difference of 0.060%), Ottawa (5.7%, a difference of 0.10%), and Central American Indian (5.7%, a difference of 0.11%).
| Demographics | Rating | Rank | Unemployment Among Ages 65 to 74 years |
| Mexican American Indians | 0.1 /100 | #278 | Tragic 5.7% |
| Immigrants | Norway | 0.1 /100 | #279 | Tragic 5.7% |
| Moroccans | 0.1 /100 | #280 | Tragic 5.7% |
| Immigrants | West Indies | 0.1 /100 | #281 | Tragic 5.7% |
| Ottawa | 0.1 /100 | #282 | Tragic 5.7% |
| Cypriots | 0.1 /100 | #283 | Tragic 5.7% |
| Chippewa | 0.1 /100 | #284 | Tragic 5.7% |
| Immigrants | Sierra Leone | 0.1 /100 | #285 | Tragic 5.7% |
| Marshallese | 0.1 /100 | #286 | Tragic 5.7% |
| Central American Indians | 0.0 /100 | #287 | Tragic 5.7% |
| Central Americans | 0.0 /100 | #288 | Tragic 5.7% |
| Immigrants | Somalia | 0.0 /100 | #289 | Tragic 5.7% |
| Spanish American Indians | 0.0 /100 | #290 | Tragic 5.7% |
| Portuguese | 0.0 /100 | #291 | Tragic 5.7% |
| U.S. Virgin Islanders | 0.0 /100 | #292 | Tragic 5.8% |
Demographics Similar to British West Indians by Unemployment Among Ages 65 to 74 years
In terms of unemployment among ages 65 to 74 years, the demographic groups most similar to British West Indians are Cheyenne (5.8%, a difference of 0.0%), Mexican (5.8%, a difference of 0.010%), Arapaho (5.8%, a difference of 0.020%), Salvadoran (5.8%, a difference of 0.020%), and Liberian (5.8%, a difference of 0.050%).
| Demographics | Rating | Rank | Unemployment Among Ages 65 to 74 years |
| Ecuadorians | 0.0 /100 | #300 | Tragic 5.8% |
| Armenians | 0.0 /100 | #301 | Tragic 5.8% |
| Liberians | 0.0 /100 | #302 | Tragic 5.8% |
| Arapaho | 0.0 /100 | #303 | Tragic 5.8% |
| Salvadorans | 0.0 /100 | #304 | Tragic 5.8% |
| Mexicans | 0.0 /100 | #305 | Tragic 5.8% |
| Cheyenne | 0.0 /100 | #306 | Tragic 5.8% |
| British West Indians | 0.0 /100 | #307 | Tragic 5.8% |
| Guatemalans | 0.0 /100 | #308 | Tragic 5.8% |
| Immigrants | Ecuador | 0.0 /100 | #309 | Tragic 5.8% |
| Immigrants | Bangladesh | 0.0 /100 | #310 | Tragic 5.9% |
| Venezuelans | 0.0 /100 | #311 | Tragic 5.9% |
| Hispanics or Latinos | 0.0 /100 | #312 | Tragic 5.9% |
| Vietnamese | 0.0 /100 | #313 | Tragic 5.9% |
| Immigrants | Venezuela | 0.0 /100 | #314 | Tragic 5.9% |