Chinese vs Bhutanese Unemployment Among Women with Children Under 18 years
COMPARE
Chinese
Bhutanese
Unemployment Among Women with Children Under 18 years
Unemployment Among Women with Children Under 18 years Comparison
Chinese
Bhutanese
4.9%
UNEMPLOYMENT AMONG WOMEN WITH CHILDREN UNDER 18 YEARS
99.5/ 100
METRIC RATING
25th/ 347
METRIC RANK
5.0%
UNEMPLOYMENT AMONG WOMEN WITH CHILDREN UNDER 18 YEARS
99.2/ 100
METRIC RATING
38th/ 347
METRIC RANK
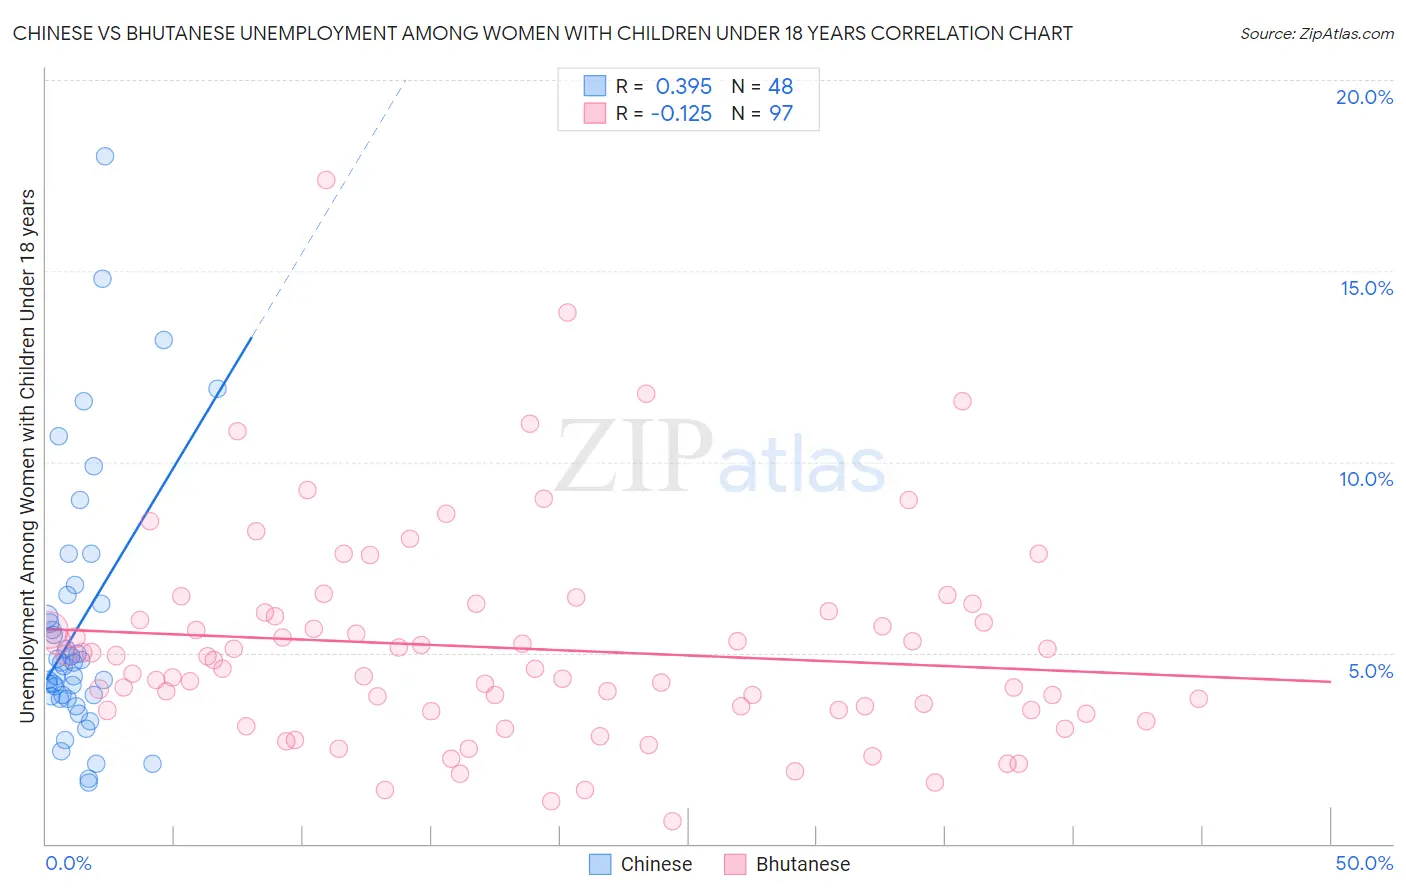
Chinese vs Bhutanese Unemployment Among Women with Children Under 18 years Correlation Chart
The statistical analysis conducted on geographies consisting of 64,132,975 people shows a mild positive correlation between the proportion of Chinese and unemployment rate among women with children under the age of 18 in the United States with a correlation coefficient (R) of 0.395 and weighted average of 4.9%. Similarly, the statistical analysis conducted on geographies consisting of 433,070,869 people shows a poor negative correlation between the proportion of Bhutanese and unemployment rate among women with children under the age of 18 in the United States with a correlation coefficient (R) of -0.125 and weighted average of 5.0%, a difference of 1.2%.
Unemployment Among Women with Children Under 18 years Correlation Summary
| Measurement | Chinese | Bhutanese |
| Minimum | 1.6% | 0.60% |
| Maximum | 18.0% | 17.4% |
| Range | 16.4% | 16.8% |
| Mean | 5.7% | 5.1% |
| Median | 4.7% | 4.6% |
| Interquartile 25% (IQ1) | 3.8% | 3.5% |
| Interquartile 75% (IQ3) | 6.4% | 6.0% |
| Interquartile Range (IQR) | 2.6% | 2.5% |
| Standard Deviation (Sample) | 3.5% | 2.8% |
| Standard Deviation (Population) | 3.4% | 2.7% |
Demographics Similar to Chinese and Bhutanese by Unemployment Among Women with Children Under 18 years
In terms of unemployment among women with children under 18 years, the demographic groups most similar to Chinese are Belgian (4.9%, a difference of 0.010%), Immigrants from China (4.9%, a difference of 0.10%), Swiss (4.9%, a difference of 0.11%), Soviet Union (4.9%, a difference of 0.18%), and Indian (Asian) (4.9%, a difference of 0.30%). Similarly, the demographic groups most similar to Bhutanese are Polish (5.0%, a difference of 0.030%), Mongolian (5.0%, a difference of 0.050%), English (5.0%, a difference of 0.10%), Luxembourger (5.0%, a difference of 0.11%), and Immigrants from South Central Asia (5.0%, a difference of 0.16%).
| Demographics | Rating | Rank | Unemployment Among Women with Children Under 18 years |
| Europeans | 99.6 /100 | #21 | Exceptional 4.9% |
| Indians (Asian) | 99.6 /100 | #22 | Exceptional 4.9% |
| Immigrants | China | 99.6 /100 | #23 | Exceptional 4.9% |
| Belgians | 99.5 /100 | #24 | Exceptional 4.9% |
| Chinese | 99.5 /100 | #25 | Exceptional 4.9% |
| Swiss | 99.5 /100 | #26 | Exceptional 4.9% |
| Soviet Union | 99.5 /100 | #27 | Exceptional 4.9% |
| Immigrants | Eastern Asia | 99.5 /100 | #28 | Exceptional 4.9% |
| Finns | 99.4 /100 | #29 | Exceptional 4.9% |
| Burmese | 99.4 /100 | #30 | Exceptional 4.9% |
| Cypriots | 99.3 /100 | #31 | Exceptional 5.0% |
| Dutch | 99.3 /100 | #32 | Exceptional 5.0% |
| Croatians | 99.3 /100 | #33 | Exceptional 5.0% |
| Immigrants | South Central Asia | 99.2 /100 | #34 | Exceptional 5.0% |
| Luxembourgers | 99.2 /100 | #35 | Exceptional 5.0% |
| Mongolians | 99.2 /100 | #36 | Exceptional 5.0% |
| Poles | 99.2 /100 | #37 | Exceptional 5.0% |
| Bhutanese | 99.2 /100 | #38 | Exceptional 5.0% |
| English | 99.1 /100 | #39 | Exceptional 5.0% |
| Greeks | 99.0 /100 | #40 | Exceptional 5.0% |
| Immigrants | Bosnia and Herzegovina | 99.0 /100 | #41 | Exceptional 5.0% |