Chinese vs Bhutanese 1st Grade
COMPARE
Chinese
Bhutanese
1st Grade
1st Grade Comparison
Chinese
Bhutanese
98.5%
1ST GRADE
100.0/ 100
METRIC RATING
35th/ 347
METRIC RANK
98.2%
1ST GRADE
97.3/ 100
METRIC RATING
108th/ 347
METRIC RANK
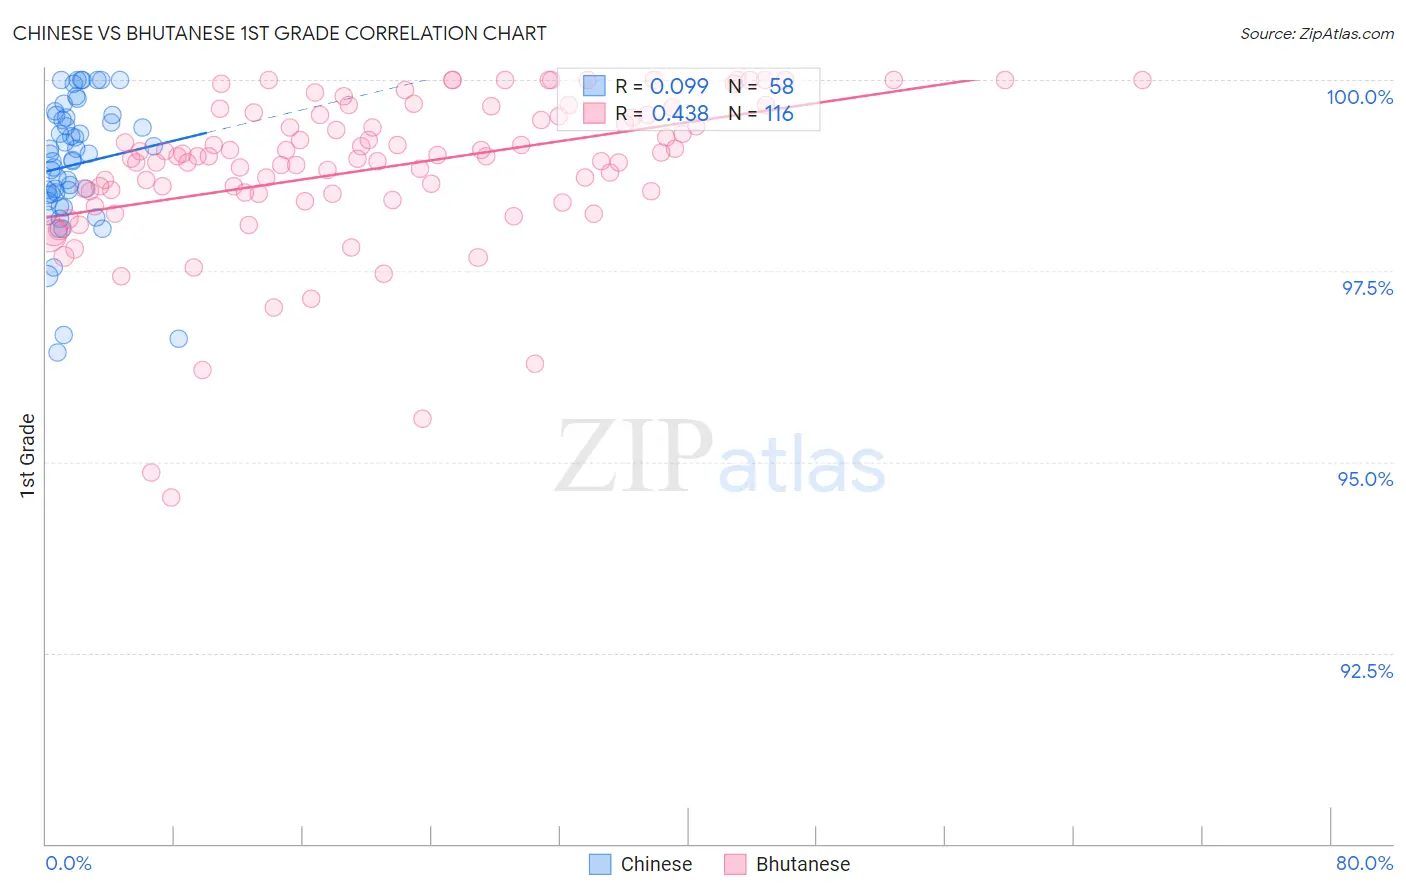
Chinese vs Bhutanese 1st Grade Correlation Chart
The statistical analysis conducted on geographies consisting of 64,808,307 people shows a slight positive correlation between the proportion of Chinese and percentage of population with at least 1st grade education in the United States with a correlation coefficient (R) of 0.099 and weighted average of 98.5%. Similarly, the statistical analysis conducted on geographies consisting of 455,591,119 people shows a moderate positive correlation between the proportion of Bhutanese and percentage of population with at least 1st grade education in the United States with a correlation coefficient (R) of 0.438 and weighted average of 98.2%, a difference of 0.33%.
1st Grade Correlation Summary
| Measurement | Chinese | Bhutanese |
| Minimum | 96.4% | 94.5% |
| Maximum | 100.0% | 100.0% |
| Range | 3.6% | 5.5% |
| Mean | 98.9% | 98.9% |
| Median | 99.0% | 99.0% |
| Interquartile 25% (IQ1) | 98.5% | 98.5% |
| Interquartile 75% (IQ3) | 99.5% | 99.5% |
| Interquartile Range (IQR) | 1.0% | 1.0% |
| Standard Deviation (Sample) | 0.85% | 1.0% |
| Standard Deviation (Population) | 0.84% | 1.0% |
Similar Demographics by 1st Grade
Demographics Similar to Chinese by 1st Grade
In terms of 1st grade, the demographic groups most similar to Chinese are Swiss (98.5%, a difference of 0.0%), British (98.5%, a difference of 0.010%), European (98.5%, a difference of 0.030%), Czech (98.5%, a difference of 0.030%), and French Canadian (98.5%, a difference of 0.030%).
| Demographics | Rating | Rank | 1st Grade |
| Croatians | 100.0 /100 | #28 | Exceptional 98.6% |
| French | 100.0 /100 | #29 | Exceptional 98.6% |
| Europeans | 100.0 /100 | #30 | Exceptional 98.5% |
| Czechs | 100.0 /100 | #31 | Exceptional 98.5% |
| French Canadians | 100.0 /100 | #32 | Exceptional 98.5% |
| Scandinavians | 100.0 /100 | #33 | Exceptional 98.5% |
| Swiss | 100.0 /100 | #34 | Exceptional 98.5% |
| Chinese | 100.0 /100 | #35 | Exceptional 98.5% |
| British | 100.0 /100 | #36 | Exceptional 98.5% |
| Italians | 99.9 /100 | #37 | Exceptional 98.5% |
| Chippewa | 99.9 /100 | #38 | Exceptional 98.5% |
| Latvians | 99.9 /100 | #39 | Exceptional 98.5% |
| Luxembourgers | 99.9 /100 | #40 | Exceptional 98.5% |
| Eastern Europeans | 99.9 /100 | #41 | Exceptional 98.5% |
| Native Hawaiians | 99.9 /100 | #42 | Exceptional 98.5% |
Demographics Similar to Bhutanese by 1st Grade
In terms of 1st grade, the demographic groups most similar to Bhutanese are Basque (98.2%, a difference of 0.0%), Turkish (98.2%, a difference of 0.0%), Immigrants from Switzerland (98.2%, a difference of 0.0%), German Russian (98.2%, a difference of 0.0%), and Pima (98.2%, a difference of 0.010%).
| Demographics | Rating | Rank | 1st Grade |
| Romanians | 97.8 /100 | #101 | Exceptional 98.2% |
| Cree | 97.8 /100 | #102 | Exceptional 98.2% |
| Immigrants | Ireland | 97.7 /100 | #103 | Exceptional 98.2% |
| Pima | 97.5 /100 | #104 | Exceptional 98.2% |
| Basques | 97.4 /100 | #105 | Exceptional 98.2% |
| Turks | 97.4 /100 | #106 | Exceptional 98.2% |
| Immigrants | Switzerland | 97.3 /100 | #107 | Exceptional 98.2% |
| Bhutanese | 97.3 /100 | #108 | Exceptional 98.2% |
| German Russians | 97.1 /100 | #109 | Exceptional 98.2% |
| Immigrants | Singapore | 96.7 /100 | #110 | Exceptional 98.2% |
| Immigrants | Czechoslovakia | 96.6 /100 | #111 | Exceptional 98.2% |
| Immigrants | Norway | 96.6 /100 | #112 | Exceptional 98.2% |
| Immigrants | Latvia | 96.4 /100 | #113 | Exceptional 98.2% |
| Ute | 96.2 /100 | #114 | Exceptional 98.2% |
| Iranians | 96.0 /100 | #115 | Exceptional 98.2% |