Chilean vs Senegalese Unemployment Among Youth under 25 years
COMPARE
Chilean
Senegalese
Unemployment Among Youth under 25 years
Unemployment Among Youth under 25 years Comparison
Chileans
Senegalese
11.3%
UNEMPLOYMENT AMONG YOUTH UNDER 25 YEARS
93.0/ 100
METRIC RATING
106th/ 347
METRIC RANK
13.5%
UNEMPLOYMENT AMONG YOUTH UNDER 25 YEARS
0.0/ 100
METRIC RATING
296th/ 347
METRIC RANK
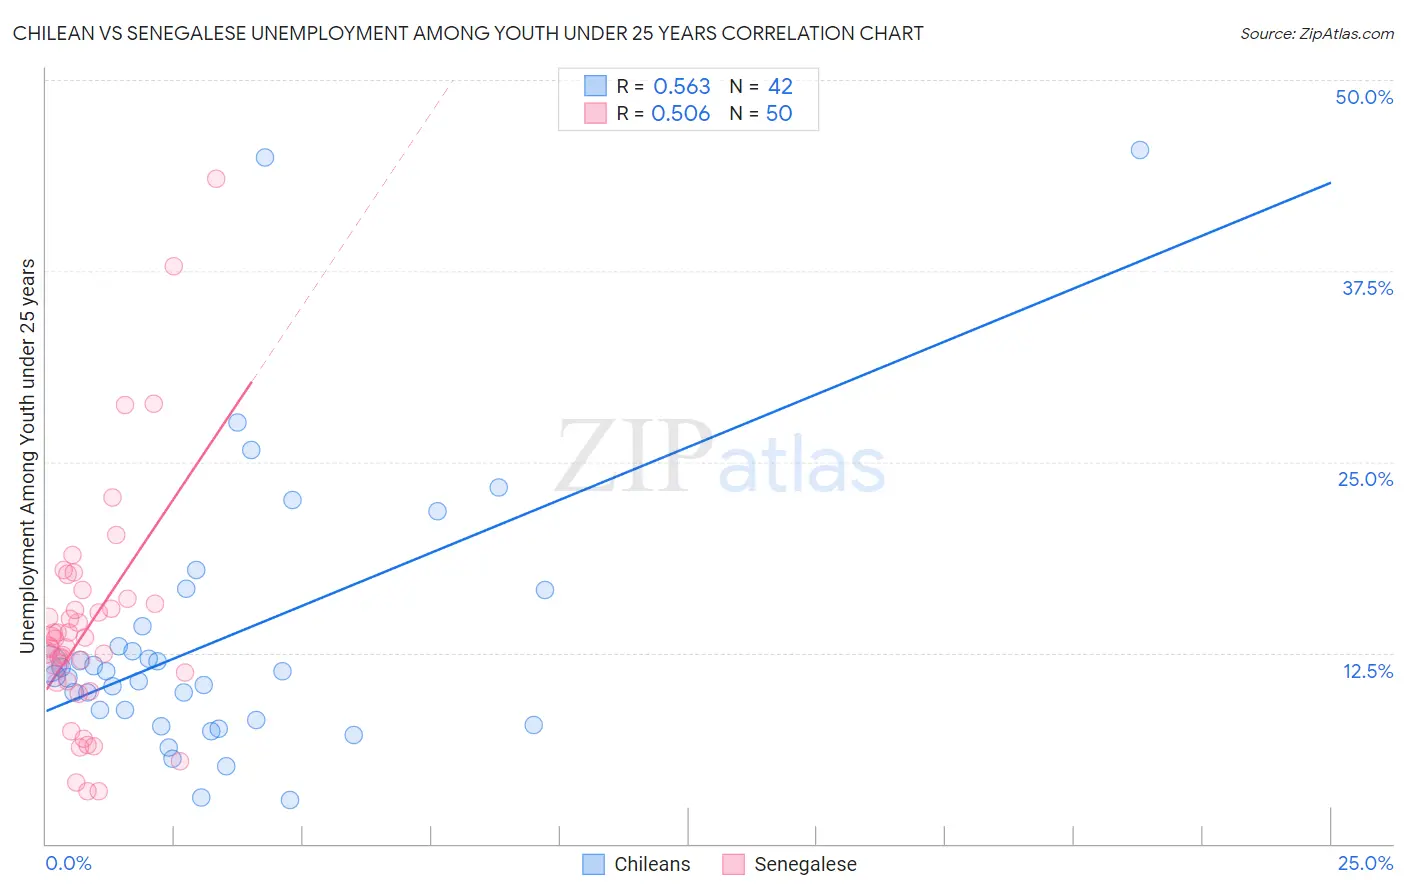
Chilean vs Senegalese Unemployment Among Youth under 25 years Correlation Chart
The statistical analysis conducted on geographies consisting of 255,472,844 people shows a substantial positive correlation between the proportion of Chileans and unemployment rate among youth under the age of 25 in the United States with a correlation coefficient (R) of 0.563 and weighted average of 11.3%. Similarly, the statistical analysis conducted on geographies consisting of 78,068,880 people shows a substantial positive correlation between the proportion of Senegalese and unemployment rate among youth under the age of 25 in the United States with a correlation coefficient (R) of 0.506 and weighted average of 13.5%, a difference of 19.8%.
Unemployment Among Youth under 25 years Correlation Summary
| Measurement | Chilean | Senegalese |
| Minimum | 2.9% | 3.4% |
| Maximum | 45.4% | 43.5% |
| Range | 42.5% | 40.1% |
| Mean | 13.4% | 14.2% |
| Median | 11.1% | 13.2% |
| Interquartile 25% (IQ1) | 8.1% | 10.7% |
| Interquartile 75% (IQ3) | 14.2% | 15.7% |
| Interquartile Range (IQR) | 6.1% | 5.0% |
| Standard Deviation (Sample) | 9.1% | 7.6% |
| Standard Deviation (Population) | 9.0% | 7.5% |
Similar Demographics by Unemployment Among Youth under 25 years
Demographics Similar to Chileans by Unemployment Among Youth under 25 years
In terms of unemployment among youth under 25 years, the demographic groups most similar to Chileans are Immigrants from Jordan (11.3%, a difference of 0.010%), Immigrants from Lithuania (11.3%, a difference of 0.020%), Immigrants from Kuwait (11.3%, a difference of 0.030%), Immigrants from Afghanistan (11.3%, a difference of 0.070%), and Immigrants from Thailand (11.3%, a difference of 0.090%).
| Demographics | Rating | Rank | Unemployment Among Youth under 25 years |
| Celtics | 94.0 /100 | #99 | Exceptional 11.3% |
| Pakistanis | 94.0 /100 | #100 | Exceptional 11.3% |
| Iroquois | 93.8 /100 | #101 | Exceptional 11.3% |
| Immigrants | Thailand | 93.6 /100 | #102 | Exceptional 11.3% |
| Immigrants | Malaysia | 93.6 /100 | #103 | Exceptional 11.3% |
| Immigrants | Afghanistan | 93.4 /100 | #104 | Exceptional 11.3% |
| Immigrants | Jordan | 93.1 /100 | #105 | Exceptional 11.3% |
| Chileans | 93.0 /100 | #106 | Exceptional 11.3% |
| Immigrants | Lithuania | 92.9 /100 | #107 | Exceptional 11.3% |
| Immigrants | Kuwait | 92.9 /100 | #108 | Exceptional 11.3% |
| Iranians | 92.0 /100 | #109 | Exceptional 11.3% |
| Immigrants | Norway | 91.5 /100 | #110 | Exceptional 11.3% |
| Immigrants | France | 90.3 /100 | #111 | Exceptional 11.3% |
| Immigrants | Austria | 90.3 /100 | #112 | Exceptional 11.3% |
| Fijians | 90.2 /100 | #113 | Exceptional 11.3% |
Demographics Similar to Senegalese by Unemployment Among Youth under 25 years
In terms of unemployment among youth under 25 years, the demographic groups most similar to Senegalese are Chippewa (13.5%, a difference of 0.020%), Immigrants from Caribbean (13.5%, a difference of 0.26%), Spanish American Indian (13.5%, a difference of 0.43%), Central American Indian (13.5%, a difference of 0.54%), and Apache (13.5%, a difference of 0.57%).
| Demographics | Rating | Rank | Unemployment Among Youth under 25 years |
| Immigrants | Ghana | 0.0 /100 | #289 | Tragic 13.4% |
| Immigrants | Ecuador | 0.0 /100 | #290 | Tragic 13.4% |
| Apache | 0.0 /100 | #291 | Tragic 13.5% |
| Central American Indians | 0.0 /100 | #292 | Tragic 13.5% |
| Spanish American Indians | 0.0 /100 | #293 | Tragic 13.5% |
| Immigrants | Caribbean | 0.0 /100 | #294 | Tragic 13.5% |
| Chippewa | 0.0 /100 | #295 | Tragic 13.5% |
| Senegalese | 0.0 /100 | #296 | Tragic 13.5% |
| U.S. Virgin Islanders | 0.0 /100 | #297 | Tragic 13.6% |
| Shoshone | 0.0 /100 | #298 | Tragic 13.7% |
| Tohono O'odham | 0.0 /100 | #299 | Tragic 13.8% |
| Immigrants | Cabo Verde | 0.0 /100 | #300 | Tragic 13.8% |
| Immigrants | Senegal | 0.0 /100 | #301 | Tragic 13.8% |
| Immigrants | Sierra Leone | 0.0 /100 | #302 | Tragic 13.8% |
| Belizeans | 0.0 /100 | #303 | Tragic 13.8% |