Chickasaw vs Scotch-Irish Unemployment Among Seniors over 75 years
COMPARE
Chickasaw
Scotch-Irish
Unemployment Among Seniors over 75 years
Unemployment Among Seniors over 75 years Comparison
Chickasaw
Scotch-Irish
7.3%
UNEMPLOYMENT AMONG SENIORS OVER 75 YEARS
100.0/ 100
METRIC RATING
21st/ 347
METRIC RANK
10.0%
UNEMPLOYMENT AMONG SENIORS OVER 75 YEARS
0.0/ 100
METRIC RATING
304th/ 347
METRIC RANK
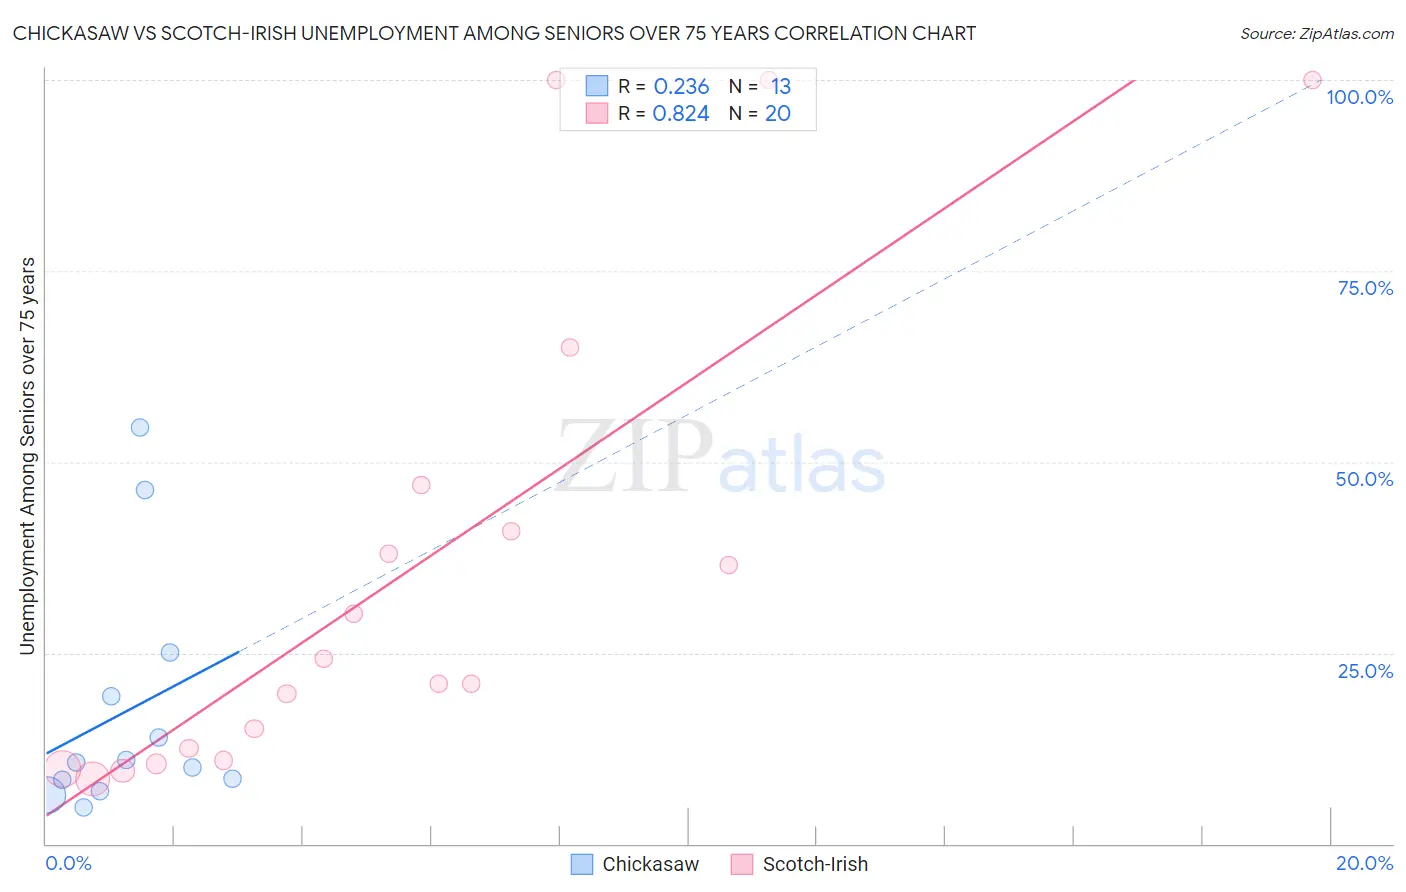
Chickasaw vs Scotch-Irish Unemployment Among Seniors over 75 years Correlation Chart
The statistical analysis conducted on geographies consisting of 100,989,035 people shows a weak positive correlation between the proportion of Chickasaw and unemployment rate among seniors over the age of 75 in the United States with a correlation coefficient (R) of 0.236 and weighted average of 7.3%. Similarly, the statistical analysis conducted on geographies consisting of 229,322,772 people shows a very strong positive correlation between the proportion of Scotch-Irish and unemployment rate among seniors over the age of 75 in the United States with a correlation coefficient (R) of 0.824 and weighted average of 10.0%, a difference of 35.8%.
Unemployment Among Seniors over 75 years Correlation Summary
| Measurement | Chickasaw | Scotch-Irish |
| Minimum | 4.7% | 8.5% |
| Maximum | 54.5% | 100.0% |
| Range | 49.8% | 91.5% |
| Mean | 17.4% | 36.0% |
| Median | 10.7% | 22.6% |
| Interquartile 25% (IQ1) | 7.7% | 11.7% |
| Interquartile 75% (IQ3) | 22.2% | 44.0% |
| Interquartile Range (IQR) | 14.5% | 32.3% |
| Standard Deviation (Sample) | 15.8% | 31.3% |
| Standard Deviation (Population) | 15.1% | 30.5% |
Similar Demographics by Unemployment Among Seniors over 75 years
Demographics Similar to Chickasaw by Unemployment Among Seniors over 75 years
In terms of unemployment among seniors over 75 years, the demographic groups most similar to Chickasaw are Cypriot (7.4%, a difference of 0.76%), Israeli (7.4%, a difference of 1.1%), Immigrants from Cuba (7.4%, a difference of 1.2%), Armenian (7.2%, a difference of 1.4%), and Immigrants from Zaire (7.2%, a difference of 1.7%).
| Demographics | Rating | Rank | Unemployment Among Seniors over 75 years |
| Ute | 100.0 /100 | #14 | Exceptional 6.8% |
| Icelanders | 100.0 /100 | #15 | Exceptional 7.0% |
| Seminole | 100.0 /100 | #16 | Exceptional 7.1% |
| Immigrants | Switzerland | 100.0 /100 | #17 | Exceptional 7.2% |
| Immigrants | Uzbekistan | 100.0 /100 | #18 | Exceptional 7.2% |
| Immigrants | Zaire | 100.0 /100 | #19 | Exceptional 7.2% |
| Armenians | 100.0 /100 | #20 | Exceptional 7.2% |
| Chickasaw | 100.0 /100 | #21 | Exceptional 7.3% |
| Cypriots | 100.0 /100 | #22 | Exceptional 7.4% |
| Israelis | 100.0 /100 | #23 | Exceptional 7.4% |
| Immigrants | Cuba | 100.0 /100 | #24 | Exceptional 7.4% |
| Immigrants | Uruguay | 100.0 /100 | #25 | Exceptional 7.5% |
| South Africans | 100.0 /100 | #26 | Exceptional 7.5% |
| Immigrants | Barbados | 100.0 /100 | #27 | Exceptional 7.6% |
| Immigrants | Israel | 100.0 /100 | #28 | Exceptional 7.6% |
Demographics Similar to Scotch-Irish by Unemployment Among Seniors over 75 years
In terms of unemployment among seniors over 75 years, the demographic groups most similar to Scotch-Irish are Puget Sound Salish (10.0%, a difference of 0.010%), Finnish (10.0%, a difference of 0.080%), Welsh (10.0%, a difference of 0.19%), Swedish (10.0%, a difference of 0.19%), and Italian (10.0%, a difference of 0.34%).
| Demographics | Rating | Rank | Unemployment Among Seniors over 75 years |
| Cherokee | 0.0 /100 | #297 | Tragic 9.8% |
| Lithuanians | 0.0 /100 | #298 | Tragic 9.9% |
| Belgians | 0.0 /100 | #299 | Tragic 9.9% |
| Iraqis | 0.0 /100 | #300 | Tragic 9.9% |
| Welsh | 0.0 /100 | #301 | Tragic 10.0% |
| Finns | 0.0 /100 | #302 | Tragic 10.0% |
| Puget Sound Salish | 0.0 /100 | #303 | Tragic 10.0% |
| Scotch-Irish | 0.0 /100 | #304 | Tragic 10.0% |
| Swedes | 0.0 /100 | #305 | Tragic 10.0% |
| Italians | 0.0 /100 | #306 | Tragic 10.0% |
| Immigrants | Fiji | 0.0 /100 | #307 | Tragic 10.0% |
| Whites/Caucasians | 0.0 /100 | #308 | Tragic 10.1% |
| English | 0.0 /100 | #309 | Tragic 10.1% |
| Hungarians | 0.0 /100 | #310 | Tragic 10.1% |
| Scottish | 0.0 /100 | #311 | Tragic 10.1% |