Cheyenne vs Immigrants from St. Vincent and the Grenadines Unemployment
COMPARE
Cheyenne
Immigrants from St. Vincent and the Grenadines
Unemployment
Unemployment Comparison
Cheyenne
Immigrants from St. Vincent and the Grenadines
8.0%
UNEMPLOYMENT
0.0/ 100
METRIC RATING
337th/ 347
METRIC RANK
6.9%
UNEMPLOYMENT
0.0/ 100
METRIC RATING
320th/ 347
METRIC RANK
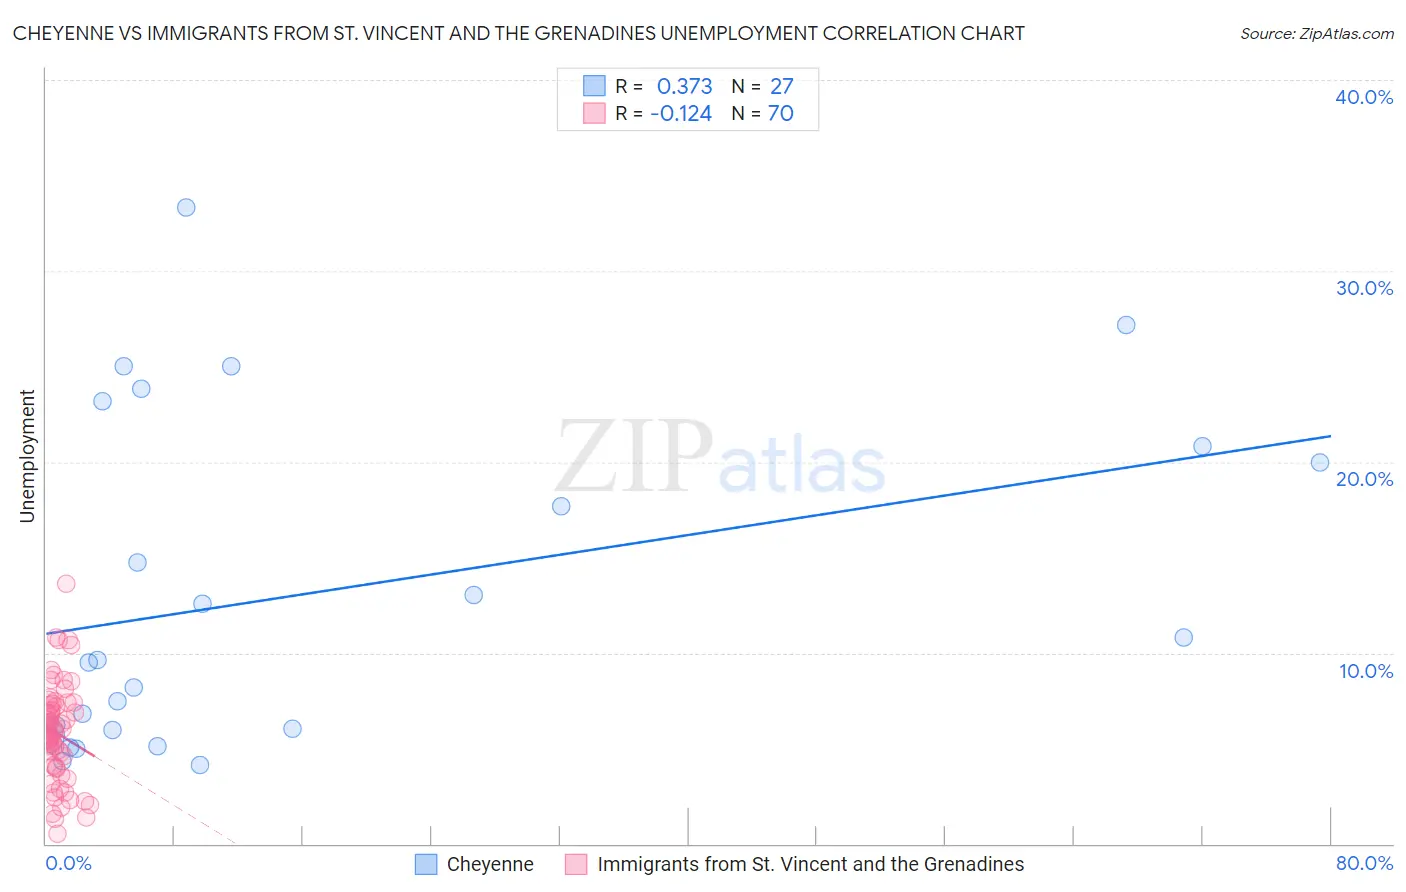
Cheyenne vs Immigrants from St. Vincent and the Grenadines Unemployment Correlation Chart
The statistical analysis conducted on geographies consisting of 80,656,490 people shows a mild positive correlation between the proportion of Cheyenne and unemployment in the United States with a correlation coefficient (R) of 0.373 and weighted average of 8.0%. Similarly, the statistical analysis conducted on geographies consisting of 56,184,646 people shows a poor negative correlation between the proportion of Immigrants from St. Vincent and the Grenadines and unemployment in the United States with a correlation coefficient (R) of -0.124 and weighted average of 6.9%, a difference of 16.1%.
Unemployment Correlation Summary
| Measurement | Cheyenne | Immigrants from St. Vincent and the Grenadines |
| Minimum | 4.1% | 0.50% |
| Maximum | 33.3% | 13.6% |
| Range | 29.2% | 13.1% |
| Mean | 13.2% | 5.8% |
| Median | 9.6% | 5.8% |
| Interquartile 25% (IQ1) | 6.0% | 4.1% |
| Interquartile 75% (IQ3) | 20.8% | 7.2% |
| Interquartile Range (IQR) | 14.8% | 3.1% |
| Standard Deviation (Sample) | 8.6% | 2.6% |
| Standard Deviation (Population) | 8.4% | 2.5% |
Demographics Similar to Cheyenne and Immigrants from St. Vincent and the Grenadines by Unemployment
In terms of unemployment, the demographic groups most similar to Cheyenne are Pima (8.2%, a difference of 2.8%), Immigrants from Yemen (7.7%, a difference of 3.8%), Alaskan Athabascan (7.7%, a difference of 4.6%), Apache (7.4%, a difference of 7.7%), and Immigrants from Dominican Republic (7.4%, a difference of 8.2%). Similarly, the demographic groups most similar to Immigrants from St. Vincent and the Grenadines are Immigrants from Guyana (6.9%, a difference of 0.010%), Guyanese (6.9%, a difference of 0.050%), Immigrants from Grenada (6.9%, a difference of 0.37%), British West Indian (6.8%, a difference of 0.79%), and Immigrants from Cabo Verde (6.8%, a difference of 1.0%).
| Demographics | Rating | Rank | Unemployment |
| Immigrants | Cabo Verde | 0.0 /100 | #318 | Tragic 6.8% |
| British West Indians | 0.0 /100 | #319 | Tragic 6.8% |
| Immigrants | St. Vincent and the Grenadines | 0.0 /100 | #320 | Tragic 6.9% |
| Immigrants | Guyana | 0.0 /100 | #321 | Tragic 6.9% |
| Guyanese | 0.0 /100 | #322 | Tragic 6.9% |
| Immigrants | Grenada | 0.0 /100 | #323 | Tragic 6.9% |
| Immigrants | Armenia | 0.0 /100 | #324 | Tragic 7.0% |
| Natives/Alaskans | 0.0 /100 | #325 | Tragic 7.0% |
| Paiute | 0.0 /100 | #326 | Tragic 7.1% |
| Pueblo | 0.0 /100 | #327 | Tragic 7.2% |
| Tsimshian | 0.0 /100 | #328 | Tragic 7.2% |
| Alaska Natives | 0.0 /100 | #329 | Tragic 7.2% |
| Yakama | 0.0 /100 | #330 | Tragic 7.3% |
| Dominicans | 0.0 /100 | #331 | Tragic 7.4% |
| Sioux | 0.0 /100 | #332 | Tragic 7.4% |
| Immigrants | Dominican Republic | 0.0 /100 | #333 | Tragic 7.4% |
| Apache | 0.0 /100 | #334 | Tragic 7.4% |
| Alaskan Athabascans | 0.0 /100 | #335 | Tragic 7.7% |
| Immigrants | Yemen | 0.0 /100 | #336 | Tragic 7.7% |
| Cheyenne | 0.0 /100 | #337 | Tragic 8.0% |
| Pima | 0.0 /100 | #338 | Tragic 8.2% |