Cheyenne vs Immigrants from Sweden Unemployment Among Seniors over 75 years

COMPARE

Cheyenne
Race
Ancestry
AfghanAfricanAlaska NativeAlaskan AthabascanAlbanianAleutAlsatianAmericanApacheArabArapahoArgentineanArmenianAssyrian/Chaldean/SyriacAustralianAustrianBahamianBangladeshiBarbadianBasqueBelgianBelizeanBermudanBhutaneseBlackfeetBolivianBrazilianBritishBritish West IndianBulgarianBurmeseCajunCambodianCanadianCape VerdeanCarpatho RusynCelticCentral AmericanCentral American IndianCherokeeCheyenneChickasawChileanChineseChippewaChoctawColombianColvilleComancheCosta RicanCreeCreekCroatianCrowCubanCypriotCzechCzechoslovakianDanishDelawareDominicanDutchDutch West IndianEastern EuropeanEcuadorianEgyptianEnglishEstonianEthiopianEuropeanFijianFilipinoFinnishFrenchFrench American IndianFrench CanadianGermanGerman RussianGhanaianGreekGuamanian/ChamorroGuatemalanGuyaneseHaitianHmongHonduranHopiHoumaHungarianIcelanderIndian (Asian)IndonesianInupiatIranianIraqiIrishIroquoisIsraeliItalianJamaicanJapaneseJordanianKenyanKiowaKoreanLaotianLatvianLebaneseLiberianLithuanianLumbeeLuxembourgerMacedonianMalaysianMalteseMarshalleseMexicanMexican American IndianMongolianMoroccanNative HawaiianNavajoNepaleseNew ZealanderNicaraguanNigerianNorthern EuropeanNorwegianOkinawanOsageOttawaPaiutePakistaniPalestinianPanamanianParaguayanPennsylvania GermanPeruvianPimaPolishPortuguesePotawatomiPuebloPuerto RicanPuget Sound SalishRomanianRussianSalvadoranSamoanScandinavianScotch-IrishScottishSeminoleSenegaleseSerbianShoshoneSierra LeoneanSiouxSlavicSlovakSloveneSomaliSouth AfricanSouth AmericanSouth American IndianSoviet UnionSpaniardSpanishSpanish AmericanSpanish American IndianSri LankanSubsaharan AfricanSudaneseSwedishSwissSyrianTaiwaneseThaiTlingit-HaidaTohono O'OdhamTonganTrinidadian and TobagonianTsimshianTurkishU.S. Virgin IslanderUgandanUkrainianUruguayanUteVenezuelanVietnameseWelshWest IndianYakamaYaquiYugoslavianYumanYup'ikZimbabwean
Immigration
NonimmigrantsImmigrantsAfghanistanAfricaAlbaniaArgentinaArmeniaAsiaAustraliaAustriaBahamasBangladeshBarbadosBelarusBelgiumBelizeBoliviaBosnia and HerzegovinaBrazilBulgariaBurma/MyanmarCabo VerdeCambodiaCameroonCanadaCaribbeanCentral AmericaChileChinaColombiaCongoCosta RicaCroatiaCubaCzechoslovakiaDenmarkDominicaDominican RepublicEastern AfricaEastern AsiaEastern EuropeEcuadorEgyptEl SalvadorEnglandEritreaEthiopiaEuropeFijiFranceGermanyGhanaGreeceGrenadaGuatemalaGuyanaHaitiHondurasHong KongHungaryIndiaIndonesiaIranIraqIrelandIsraelItalyJamaicaJapanJordanKazakhstanKenyaKoreaKuwaitLaosLatin AmericaLatviaLebanonLiberiaLithuaniaMalaysiaMexicoMicronesiaMiddle AfricaMoldovaMoroccoNepalNetherlandsNicaraguaNigeriaNorth AmericaNorth MacedoniaNorthern AfricaNorthern EuropeNorwayOceaniaPakistanPanamaPeruPhilippinesPolandPortugalRomaniaRussiaSaudi ArabiaScotlandSenegalSerbiaSierra LeoneSingaporeSomaliaSouth AfricaSouth AmericaSouth Central AsiaSouth Eastern AsiaSouthern EuropeSpainSri LankaSt. Vincent and the GrenadinesSudanSwitzerlandSyriaTaiwanThailandTrinidad and TobagoTurkeyUgandaUkraineUruguayUzbekistanVenezuelaVietnamWest IndiesWestern AfricaWestern AsiaWestern EuropeYemenZaireZimbabweAzores
Immigrants from Sweden
Race
Ancestry
AfghanAfricanAlaska NativeAlaskan AthabascanAlbanianAleutAlsatianAmericanApacheArabArapahoArgentineanArmenianAssyrian/Chaldean/SyriacAustralianAustrianBahamianBangladeshiBarbadianBasqueBelgianBelizeanBermudanBhutaneseBlackfeetBolivianBrazilianBritishBritish West IndianBulgarianBurmeseCajunCambodianCanadianCape VerdeanCarpatho RusynCelticCentral AmericanCentral American IndianCherokeeChickasawChileanChineseChippewaChoctawColombianColvilleComancheCosta RicanCreeCreekCroatianCrowCubanCypriotCzechCzechoslovakianDanishDelawareDominicanDutchDutch West IndianEastern EuropeanEcuadorianEgyptianEnglishEstonianEthiopianEuropeanFijianFilipinoFinnishFrenchFrench American IndianFrench CanadianGermanGerman RussianGhanaianGreekGuamanian/ChamorroGuatemalanGuyaneseHaitianHmongHonduranHopiHoumaHungarianIcelanderIndian (Asian)IndonesianInupiatIranianIraqiIrishIroquoisIsraeliItalianJamaicanJapaneseJordanianKenyanKiowaKoreanLaotianLatvianLebaneseLiberianLithuanianLumbeeLuxembourgerMacedonianMalaysianMalteseMarshalleseMexicanMexican American IndianMongolianMoroccanNative HawaiianNavajoNepaleseNew ZealanderNicaraguanNigerianNorthern EuropeanNorwegianOkinawanOsageOttawaPaiutePakistaniPalestinianPanamanianParaguayanPennsylvania GermanPeruvianPimaPolishPortuguesePotawatomiPuebloPuerto RicanPuget Sound SalishRomanianRussianSalvadoranSamoanScandinavianScotch-IrishScottishSeminoleSenegaleseSerbianShoshoneSierra LeoneanSiouxSlavicSlovakSloveneSomaliSouth AfricanSouth AmericanSouth American IndianSoviet UnionSpaniardSpanishSpanish AmericanSpanish American IndianSri LankanSubsaharan AfricanSudaneseSwedishSwissSyrianTaiwaneseThaiTlingit-HaidaTohono O'OdhamTonganTrinidadian and TobagonianTsimshianTurkishU.S. Virgin IslanderUgandanUkrainianUruguayanUteVenezuelanVietnameseWelshWest IndianYakamaYaquiYugoslavianYumanYup'ikZimbabwean
Immigration
NonimmigrantsImmigrantsAfghanistanAfricaAlbaniaArgentinaArmeniaAsiaAustraliaAustriaBahamasBangladeshBarbadosBelarusBelgiumBelizeBoliviaBosnia and HerzegovinaBrazilBulgariaBurma/MyanmarCabo VerdeCambodiaCameroonCanadaCaribbeanCentral AmericaChileChinaColombiaCongoCosta RicaCroatiaCubaCzechoslovakiaDenmarkDominicaDominican RepublicEastern AfricaEastern AsiaEastern EuropeEcuadorEgyptEl SalvadorEnglandEritreaEthiopiaEuropeFijiFranceGermanyGhanaGreeceGrenadaGuatemalaGuyanaHaitiHondurasHong KongHungaryIndiaIndonesiaIranIraqIrelandIsraelItalyJamaicaJapanJordanKazakhstanKenyaKoreaKuwaitLaosLatin AmericaLatviaLebanonLiberiaLithuaniaMalaysiaMexicoMicronesiaMiddle AfricaMoldovaMoroccoNepalNetherlandsNicaraguaNigeriaNorth AmericaNorth MacedoniaNorthern AfricaNorthern EuropeNorwayOceaniaPakistanPanamaPeruPhilippinesPolandPortugalRomaniaRussiaSaudi ArabiaScotlandSenegalSerbiaSierra LeoneSingaporeSomaliaSouth AfricaSouth AmericaSouth Central AsiaSouth Eastern AsiaSouthern EuropeSpainSri LankaSt. Vincent and the GrenadinesSudanSwedenSwitzerlandSyriaTaiwanThailandTrinidad and TobagoTurkeyUgandaUkraineUruguayUzbekistanVenezuelaVietnamWest IndiesWestern AfricaWestern AsiaWestern EuropeYemenZaireZimbabweAzores
Unemployment Among Seniors over 75 years
Income
Poverty
Unemployment
Labor Participation
Family Structure
Vehicle Availability
Education Level
Disability

Unemployment Among Seniors over 75 years Comparison

Cheyenne

Immigrants from Sweden

Exceptional
Exceptional
5.9%
UNEMPLOYMENT AMONG SENIORS OVER 75 YEARS
100.0/ 100
METRIC RATING
3rd/ 347
METRIC RANK
7.6%
UNEMPLOYMENT AMONG SENIORS OVER 75 YEARS
100.0/ 100
METRIC RATING
30th/ 347
METRIC RANK

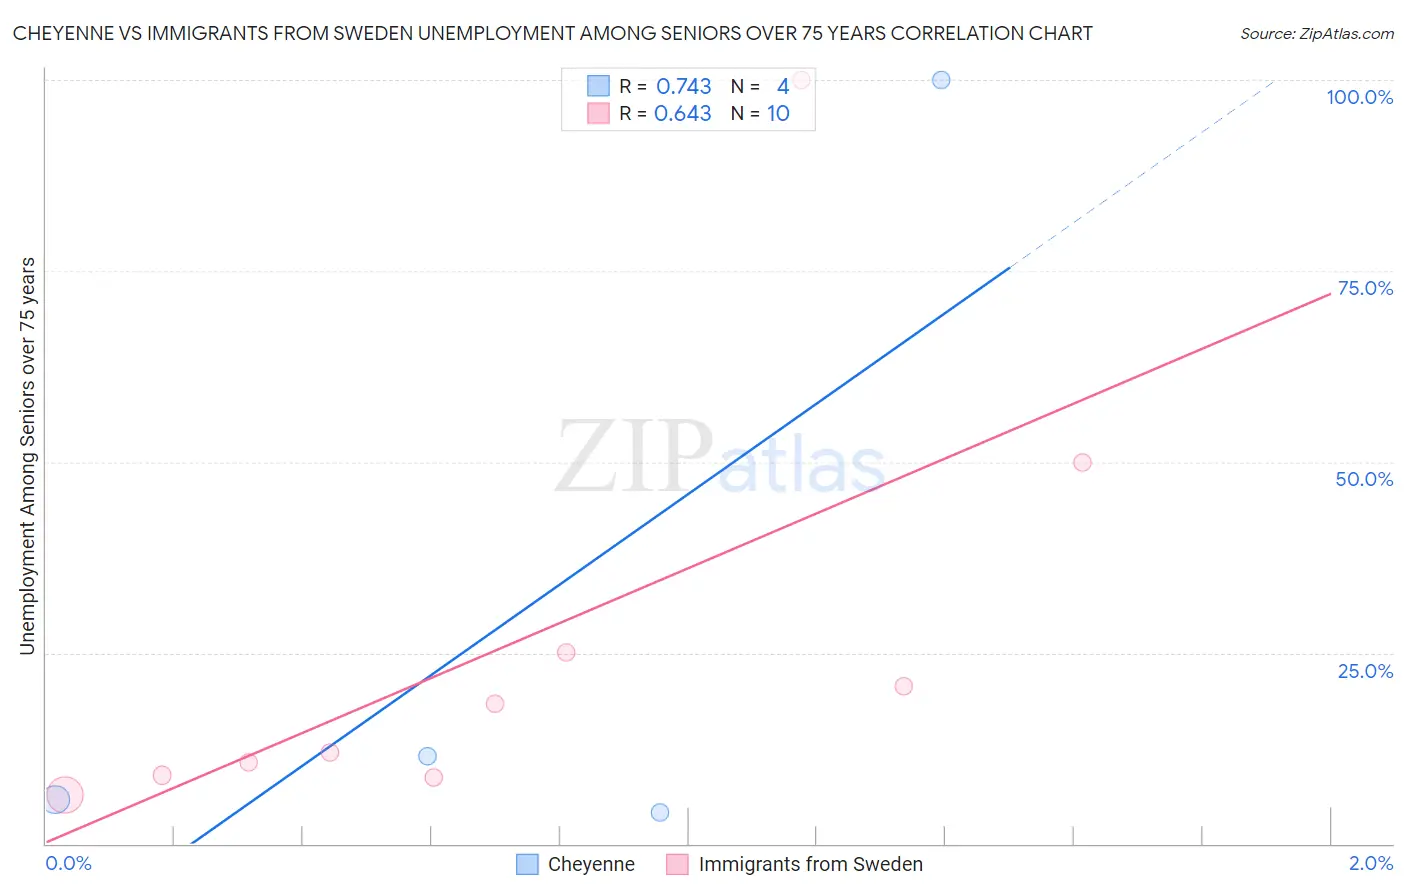
Cheyenne vs Immigrants from Sweden Unemployment Among Seniors over 75 years Correlation Chart

The statistical analysis conducted on geographies consisting of 63,002,461 people shows a strong positive correlation between the proportion of Cheyenne and unemployment rate among seniors over the age of 75 in the United States with a correlation coefficient (R) of 0.743 and weighted average of 5.9%. Similarly, the statistical analysis conducted on geographies consisting of 113,907,096 people shows a significant positive correlation between the proportion of Immigrants from Sweden and unemployment rate among seniors over the age of 75 in the United States with a correlation coefficient (R) of 0.643 and weighted average of 7.6%, a difference of 27.6%.
Cheyenne vs Immigrants from Sweden Unemployment Among Seniors over 75 years

Unemployment Among Seniors over 75 years Correlation Summary

MeasurementCheyenneImmigrants from Sweden
Minimum4.1%6.3%
Maximum100.0%100.0%
Range95.9%93.7%
Mean30.4%26.1%
Median8.6%15.2%
Interquartile 25% (IQ1)5.0%9.0%
Interquartile 75% (IQ3)55.8%25.0%
Interquartile Range (IQR)50.8%16.0%
Standard Deviation (Sample)46.5%29.0%
Standard Deviation (Population)40.3%27.5%

Similar Demographics by Unemployment Among Seniors over 75 years

Demographics Similar to Cheyenne by Unemployment Among Seniors over 75 years

In terms of unemployment among seniors over 75 years, the demographic groups most similar to Cheyenne are Chinese (5.9%, a difference of 0.55%), Crow (5.9%, a difference of 0.56%), Alsatian (6.1%, a difference of 2.9%), Hopi (6.3%, a difference of 5.6%), and Immigrants from Armenia (6.5%, a difference of 9.6%).
DemographicsRating | RankUnemployment Among Seniors over 75 years
Crow
100.0
/100
|
#1
Exceptional
5.9%
Chinese
100.0
/100
|
#2
Exceptional
5.9%
Cheyenne
100.0
/100
|
#3
Exceptional
5.9%
Alsatians
100.0
/100
|
#4
Exceptional
6.1%
Hopi
100.0
/100
|
#5
Exceptional
6.3%
Immigrants | Armenia
100.0
/100
|
#6
Exceptional
6.5%
Spanish American Indians
100.0
/100
|
#7
Exceptional
6.5%
Taiwanese
100.0
/100
|
#8
Exceptional
6.6%
Soviet Union
100.0
/100
|
#9
Exceptional
6.6%
Yuman
100.0
/100
|
#10
Exceptional
6.7%
Immigrants | Grenada
100.0
/100
|
#11
Exceptional
6.7%
Comanche
100.0
/100
|
#12
Exceptional
6.7%
Immigrants | Congo
100.0
/100
|
#13
Exceptional
6.7%
Ute
100.0
/100
|
#14
Exceptional
6.8%
Icelanders
100.0
/100
|
#15
Exceptional
7.0%

Demographics Similar to Immigrants from Sweden by Unemployment Among Seniors over 75 years

In terms of unemployment among seniors over 75 years, the demographic groups most similar to Immigrants from Sweden are Immigrants from Iran (7.6%, a difference of 0.11%), Immigrants from Israel (7.6%, a difference of 0.15%), Immigrants from Barbados (7.6%, a difference of 0.26%), Guyanese (7.6%, a difference of 0.37%), and South African (7.5%, a difference of 0.70%).
DemographicsRating | RankUnemployment Among Seniors over 75 years
Israelis
100.0
/100
|
#23
Exceptional
7.4%
Immigrants | Cuba
100.0
/100
|
#24
Exceptional
7.4%
Immigrants | Uruguay
100.0
/100
|
#25
Exceptional
7.5%
South Africans
100.0
/100
|
#26
Exceptional
7.5%
Immigrants | Barbados
100.0
/100
|
#27
Exceptional
7.6%
Immigrants | Israel
100.0
/100
|
#28
Exceptional
7.6%
Immigrants | Iran
100.0
/100
|
#29
Exceptional
7.6%
Immigrants | Sweden
100.0
/100
|
#30
Exceptional
7.6%
Guyanese
100.0
/100
|
#31
Exceptional
7.6%
Immigrants | Hong Kong
100.0
/100
|
#32
Exceptional
7.6%
Cambodians
100.0
/100
|
#33
Exceptional
7.6%
Immigrants | Eritrea
100.0
/100
|
#34
Exceptional
7.7%
Immigrants | Norway
100.0
/100
|
#35
Exceptional
7.7%
Luxembourgers
100.0
/100
|
#36
Exceptional
7.7%
Immigrants | Hungary
100.0
/100
|
#37
Exceptional
7.7%