Cheyenne vs Bangladeshi Unemployment Among Ages 16 to 19 years
COMPARE
Cheyenne
Bangladeshi
Unemployment Among Ages 16 to 19 years
Unemployment Among Ages 16 to 19 years Comparison
Cheyenne
Bangladeshis
22.3%
UNEMPLOYMENT AMONG AGES 16 TO 19 YEARS
0.0/ 100
METRIC RATING
320th/ 347
METRIC RANK
16.9%
UNEMPLOYMENT AMONG AGES 16 TO 19 YEARS
95.8/ 100
METRIC RATING
94th/ 347
METRIC RANK
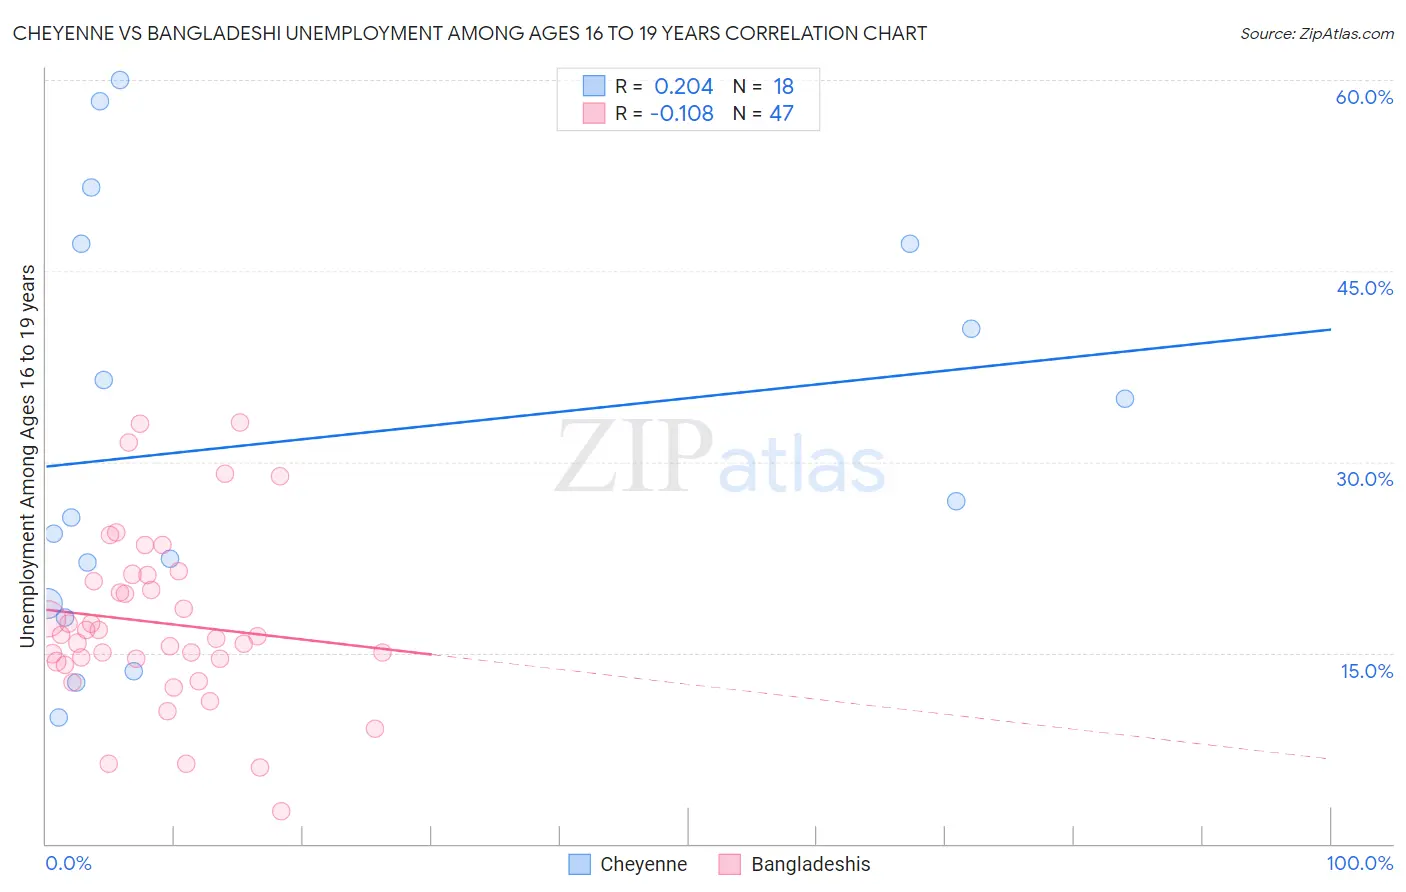
Cheyenne vs Bangladeshi Unemployment Among Ages 16 to 19 years Correlation Chart
The statistical analysis conducted on geographies consisting of 79,316,787 people shows a weak positive correlation between the proportion of Cheyenne and unemployment rate among population between the ages 16 and 19 in the United States with a correlation coefficient (R) of 0.204 and weighted average of 22.3%. Similarly, the statistical analysis conducted on geographies consisting of 138,581,653 people shows a poor negative correlation between the proportion of Bangladeshis and unemployment rate among population between the ages 16 and 19 in the United States with a correlation coefficient (R) of -0.108 and weighted average of 16.9%, a difference of 31.6%.
Unemployment Among Ages 16 to 19 years Correlation Summary
| Measurement | Cheyenne | Bangladeshi |
| Minimum | 9.9% | 2.6% |
| Maximum | 60.0% | 33.1% |
| Range | 50.1% | 30.5% |
| Mean | 31.7% | 17.4% |
| Median | 26.3% | 16.3% |
| Interquartile 25% (IQ1) | 18.9% | 14.3% |
| Interquartile 75% (IQ3) | 47.1% | 21.1% |
| Interquartile Range (IQR) | 28.2% | 6.8% |
| Standard Deviation (Sample) | 15.9% | 6.8% |
| Standard Deviation (Population) | 15.5% | 6.7% |
Similar Demographics by Unemployment Among Ages 16 to 19 years
Demographics Similar to Cheyenne by Unemployment Among Ages 16 to 19 years
In terms of unemployment among ages 16 to 19 years, the demographic groups most similar to Cheyenne are Immigrants from West Indies (22.2%, a difference of 0.23%), Immigrants from Jamaica (22.2%, a difference of 0.39%), Immigrants from Belize (22.2%, a difference of 0.54%), West Indian (22.4%, a difference of 0.70%), and Barbadian (22.5%, a difference of 0.83%).
| Demographics | Rating | Rank | Unemployment Among Ages 16 to 19 years |
| Jamaicans | 0.0 /100 | #313 | Tragic 21.7% |
| Alaska Natives | 0.0 /100 | #314 | Tragic 21.8% |
| Immigrants | Dominica | 0.0 /100 | #315 | Tragic 21.9% |
| Tohono O'odham | 0.0 /100 | #316 | Tragic 22.1% |
| Immigrants | Belize | 0.0 /100 | #317 | Tragic 22.2% |
| Immigrants | Jamaica | 0.0 /100 | #318 | Tragic 22.2% |
| Immigrants | West Indies | 0.0 /100 | #319 | Tragic 22.2% |
| Cheyenne | 0.0 /100 | #320 | Tragic 22.3% |
| West Indians | 0.0 /100 | #321 | Tragic 22.4% |
| Barbadians | 0.0 /100 | #322 | Tragic 22.5% |
| Yakama | 0.0 /100 | #323 | Tragic 22.5% |
| Immigrants | Armenia | 0.0 /100 | #324 | Tragic 22.6% |
| Trinidadians and Tobagonians | 0.0 /100 | #325 | Tragic 22.6% |
| Immigrants | Trinidad and Tobago | 0.0 /100 | #326 | Tragic 23.1% |
| Pima | 0.0 /100 | #327 | Tragic 23.1% |
Demographics Similar to Bangladeshis by Unemployment Among Ages 16 to 19 years
In terms of unemployment among ages 16 to 19 years, the demographic groups most similar to Bangladeshis are Cuban (16.9%, a difference of 0.010%), South African (16.9%, a difference of 0.050%), Mongolian (16.9%, a difference of 0.070%), Ottawa (16.9%, a difference of 0.10%), and Immigrants from Venezuela (16.9%, a difference of 0.13%).
| Demographics | Rating | Rank | Unemployment Among Ages 16 to 19 years |
| Greeks | 97.0 /100 | #87 | Exceptional 16.9% |
| Immigrants | South Africa | 96.9 /100 | #88 | Exceptional 16.9% |
| Canadians | 96.7 /100 | #89 | Exceptional 16.9% |
| Asians | 96.6 /100 | #90 | Exceptional 16.9% |
| Cambodians | 96.3 /100 | #91 | Exceptional 16.9% |
| South Africans | 95.9 /100 | #92 | Exceptional 16.9% |
| Cubans | 95.8 /100 | #93 | Exceptional 16.9% |
| Bangladeshis | 95.8 /100 | #94 | Exceptional 16.9% |
| Mongolians | 95.6 /100 | #95 | Exceptional 16.9% |
| Ottawa | 95.4 /100 | #96 | Exceptional 16.9% |
| Immigrants | Venezuela | 95.3 /100 | #97 | Exceptional 16.9% |
| Burmese | 95.0 /100 | #98 | Exceptional 17.0% |
| Immigrants | Lithuania | 94.9 /100 | #99 | Exceptional 17.0% |
| Immigrants | Thailand | 94.7 /100 | #100 | Exceptional 17.0% |
| Immigrants | Saudi Arabia | 94.7 /100 | #101 | Exceptional 17.0% |