Israeli vs Bangladeshi Unemployment Among Ages 16 to 19 years
COMPARE
Israeli
Bangladeshi
Unemployment Among Ages 16 to 19 years
Unemployment Among Ages 16 to 19 years Comparison
Israelis
Bangladeshis
19.0%
UNEMPLOYMENT AMONG AGES 16 TO 19 YEARS
0.1/ 100
METRIC RATING
267th/ 347
METRIC RANK
16.9%
UNEMPLOYMENT AMONG AGES 16 TO 19 YEARS
95.8/ 100
METRIC RATING
94th/ 347
METRIC RANK
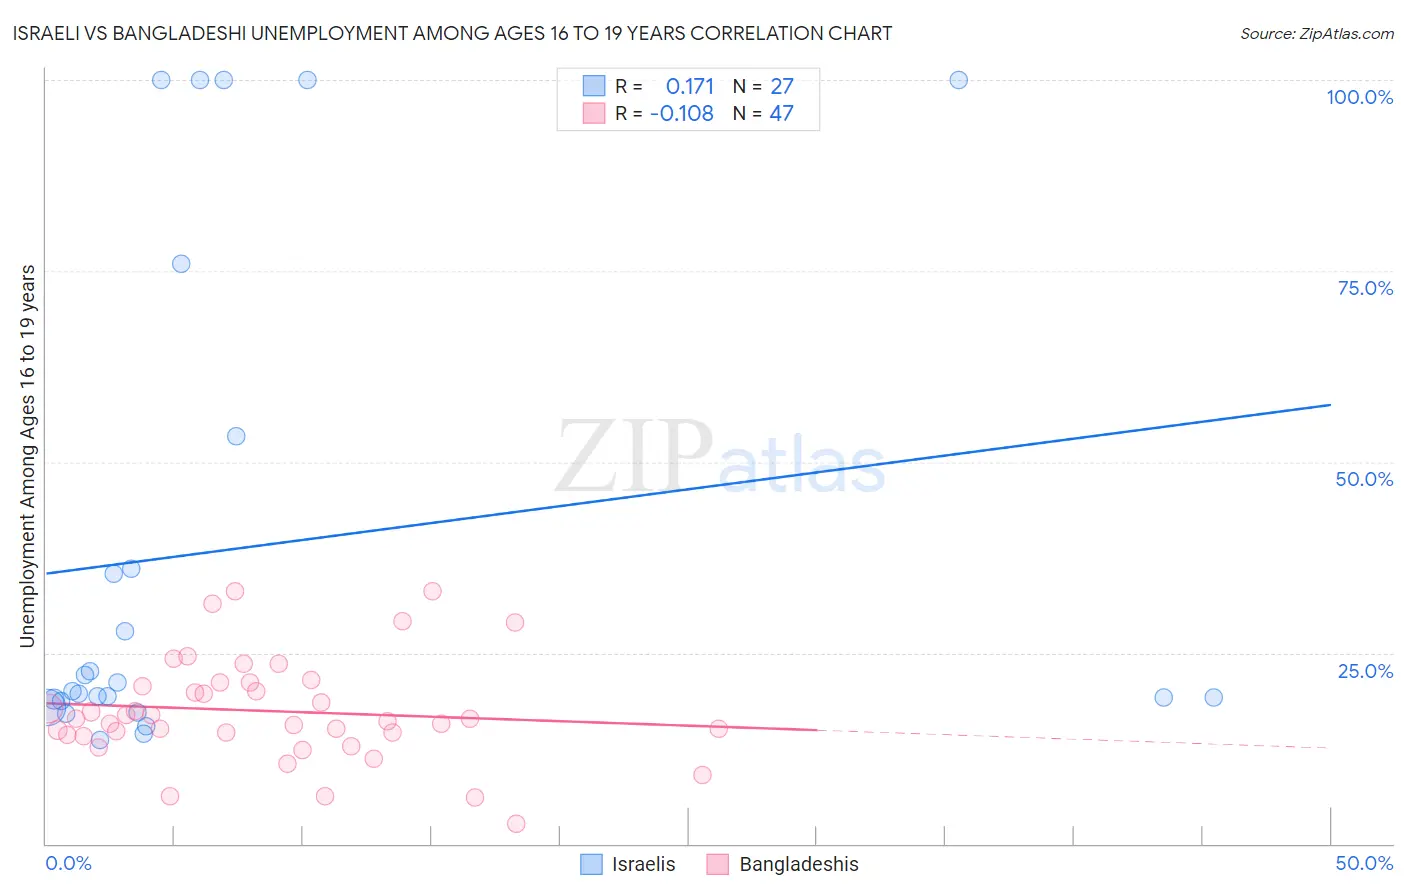
Israeli vs Bangladeshi Unemployment Among Ages 16 to 19 years Correlation Chart
The statistical analysis conducted on geographies consisting of 204,167,490 people shows a poor positive correlation between the proportion of Israelis and unemployment rate among population between the ages 16 and 19 in the United States with a correlation coefficient (R) of 0.171 and weighted average of 19.0%. Similarly, the statistical analysis conducted on geographies consisting of 138,581,653 people shows a poor negative correlation between the proportion of Bangladeshis and unemployment rate among population between the ages 16 and 19 in the United States with a correlation coefficient (R) of -0.108 and weighted average of 16.9%, a difference of 12.5%.
Unemployment Among Ages 16 to 19 years Correlation Summary
| Measurement | Israeli | Bangladeshi |
| Minimum | 13.6% | 2.6% |
| Maximum | 100.0% | 33.1% |
| Range | 86.4% | 30.5% |
| Mean | 38.7% | 17.4% |
| Median | 20.0% | 16.3% |
| Interquartile 25% (IQ1) | 18.7% | 14.3% |
| Interquartile 75% (IQ3) | 53.3% | 21.1% |
| Interquartile Range (IQR) | 34.6% | 6.8% |
| Standard Deviation (Sample) | 32.5% | 6.8% |
| Standard Deviation (Population) | 31.9% | 6.7% |
Similar Demographics by Unemployment Among Ages 16 to 19 years
Demographics Similar to Israelis by Unemployment Among Ages 16 to 19 years
In terms of unemployment among ages 16 to 19 years, the demographic groups most similar to Israelis are Immigrants from El Salvador (19.1%, a difference of 0.28%), Immigrants from Honduras (19.0%, a difference of 0.34%), Lumbee (19.1%, a difference of 0.36%), Choctaw (19.0%, a difference of 0.43%), and Yaqui (19.0%, a difference of 0.45%).
| Demographics | Rating | Rank | Unemployment Among Ages 16 to 19 years |
| Nigerians | 0.2 /100 | #260 | Tragic 18.9% |
| Spanish American Indians | 0.1 /100 | #261 | Tragic 18.9% |
| Salvadorans | 0.1 /100 | #262 | Tragic 18.9% |
| Cree | 0.1 /100 | #263 | Tragic 19.0% |
| Yaqui | 0.1 /100 | #264 | Tragic 19.0% |
| Choctaw | 0.1 /100 | #265 | Tragic 19.0% |
| Immigrants | Honduras | 0.1 /100 | #266 | Tragic 19.0% |
| Israelis | 0.1 /100 | #267 | Tragic 19.0% |
| Immigrants | El Salvador | 0.1 /100 | #268 | Tragic 19.1% |
| Lumbee | 0.1 /100 | #269 | Tragic 19.1% |
| Hondurans | 0.1 /100 | #270 | Tragic 19.2% |
| Blackfeet | 0.0 /100 | #271 | Tragic 19.2% |
| Hispanics or Latinos | 0.0 /100 | #272 | Tragic 19.2% |
| Immigrants | Panama | 0.0 /100 | #273 | Tragic 19.3% |
| Shoshone | 0.0 /100 | #274 | Tragic 19.3% |
Demographics Similar to Bangladeshis by Unemployment Among Ages 16 to 19 years
In terms of unemployment among ages 16 to 19 years, the demographic groups most similar to Bangladeshis are Cuban (16.9%, a difference of 0.010%), South African (16.9%, a difference of 0.050%), Mongolian (16.9%, a difference of 0.070%), Ottawa (16.9%, a difference of 0.10%), and Immigrants from Venezuela (16.9%, a difference of 0.13%).
| Demographics | Rating | Rank | Unemployment Among Ages 16 to 19 years |
| Greeks | 97.0 /100 | #87 | Exceptional 16.9% |
| Immigrants | South Africa | 96.9 /100 | #88 | Exceptional 16.9% |
| Canadians | 96.7 /100 | #89 | Exceptional 16.9% |
| Asians | 96.6 /100 | #90 | Exceptional 16.9% |
| Cambodians | 96.3 /100 | #91 | Exceptional 16.9% |
| South Africans | 95.9 /100 | #92 | Exceptional 16.9% |
| Cubans | 95.8 /100 | #93 | Exceptional 16.9% |
| Bangladeshis | 95.8 /100 | #94 | Exceptional 16.9% |
| Mongolians | 95.6 /100 | #95 | Exceptional 16.9% |
| Ottawa | 95.4 /100 | #96 | Exceptional 16.9% |
| Immigrants | Venezuela | 95.3 /100 | #97 | Exceptional 16.9% |
| Burmese | 95.0 /100 | #98 | Exceptional 17.0% |
| Immigrants | Lithuania | 94.9 /100 | #99 | Exceptional 17.0% |
| Immigrants | Thailand | 94.7 /100 | #100 | Exceptional 17.0% |
| Immigrants | Saudi Arabia | 94.7 /100 | #101 | Exceptional 17.0% |