Cheyenne vs Bangladeshi Unemployment Among Seniors over 65 years
COMPARE
Cheyenne
Bangladeshi
Unemployment Among Seniors over 65 years
Unemployment Among Seniors over 65 years Comparison
Cheyenne
Bangladeshis
5.5%
UNEMPLOYMENT AMONG SENIORS OVER 65 YEARS
0.0/ 100
METRIC RATING
295th/ 347
METRIC RANK
5.2%
UNEMPLOYMENT AMONG SENIORS OVER 65 YEARS
32.3/ 100
METRIC RATING
189th/ 347
METRIC RANK
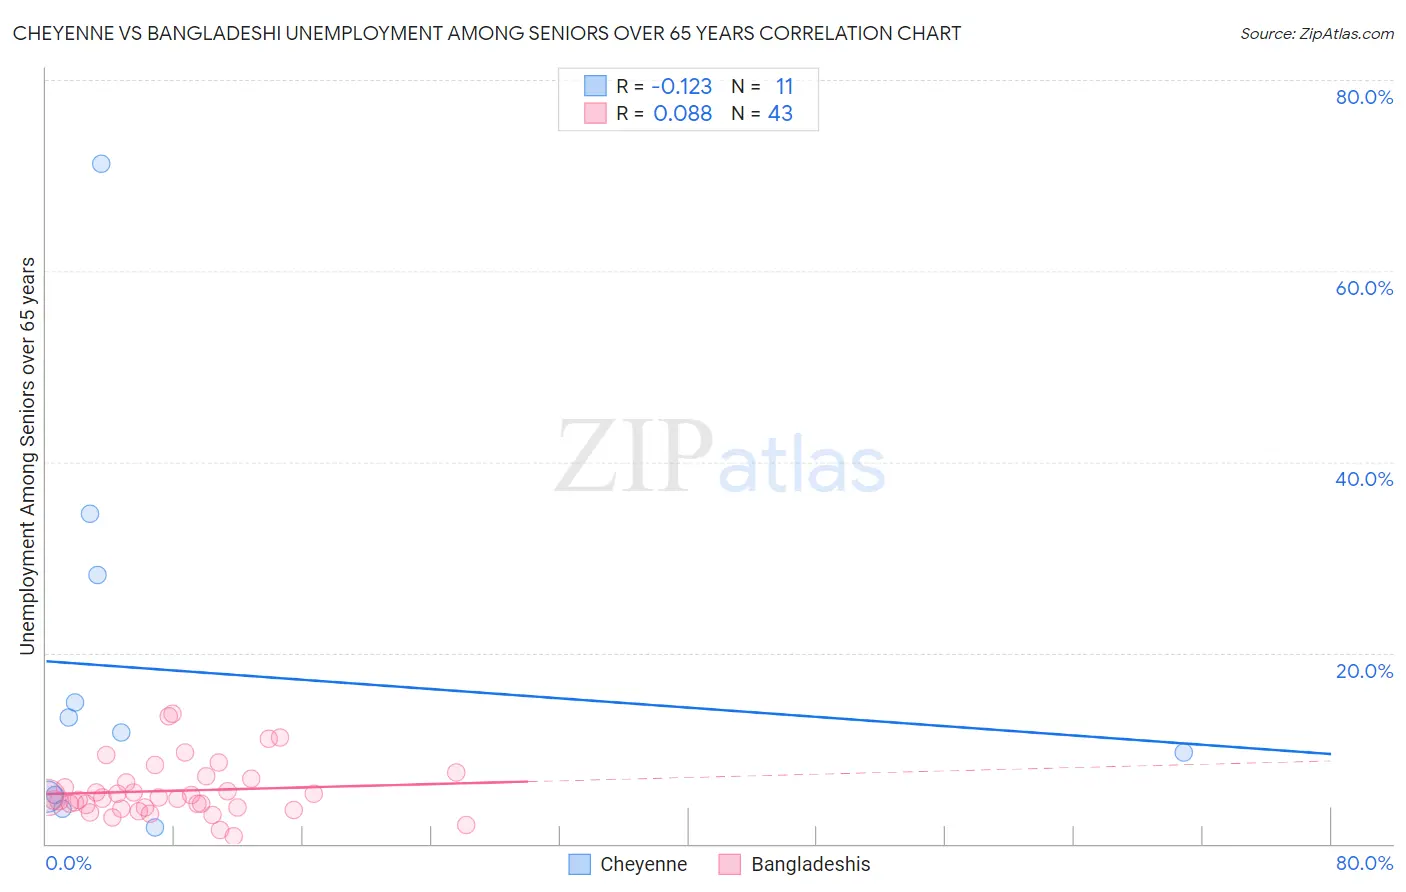
Cheyenne vs Bangladeshi Unemployment Among Seniors over 65 years Correlation Chart
The statistical analysis conducted on geographies consisting of 76,688,001 people shows a poor negative correlation between the proportion of Cheyenne and unemployment rate amomg seniors over the age of 65 in the United States with a correlation coefficient (R) of -0.123 and weighted average of 5.5%. Similarly, the statistical analysis conducted on geographies consisting of 132,453,489 people shows a slight positive correlation between the proportion of Bangladeshis and unemployment rate amomg seniors over the age of 65 in the United States with a correlation coefficient (R) of 0.088 and weighted average of 5.2%, a difference of 7.1%.
Unemployment Among Seniors over 65 years Correlation Summary
| Measurement | Cheyenne | Bangladeshi |
| Minimum | 1.7% | 0.80% |
| Maximum | 71.2% | 13.6% |
| Range | 69.5% | 12.8% |
| Mean | 18.1% | 5.6% |
| Median | 11.7% | 4.8% |
| Interquartile 25% (IQ1) | 4.9% | 3.8% |
| Interquartile 75% (IQ3) | 28.2% | 6.8% |
| Interquartile Range (IQR) | 23.3% | 3.0% |
| Standard Deviation (Sample) | 20.4% | 2.9% |
| Standard Deviation (Population) | 19.5% | 2.9% |
Similar Demographics by Unemployment Among Seniors over 65 years
Demographics Similar to Cheyenne by Unemployment Among Seniors over 65 years
In terms of unemployment among seniors over 65 years, the demographic groups most similar to Cheyenne are Cape Verdean (5.5%, a difference of 0.010%), Yaqui (5.5%, a difference of 0.020%), Armenian (5.5%, a difference of 0.070%), Immigrants from Venezuela (5.5%, a difference of 0.11%), and Immigrants from West Indies (5.6%, a difference of 0.14%).
| Demographics | Rating | Rank | Unemployment Among Seniors over 65 years |
| U.S. Virgin Islanders | 0.0 /100 | #288 | Tragic 5.5% |
| Immigrants | Cabo Verde | 0.0 /100 | #289 | Tragic 5.5% |
| Jamaicans | 0.0 /100 | #290 | Tragic 5.5% |
| Blacks/African Americans | 0.0 /100 | #291 | Tragic 5.5% |
| Belizeans | 0.0 /100 | #292 | Tragic 5.5% |
| Immigrants | Venezuela | 0.0 /100 | #293 | Tragic 5.5% |
| Armenians | 0.0 /100 | #294 | Tragic 5.5% |
| Cheyenne | 0.0 /100 | #295 | Tragic 5.5% |
| Cape Verdeans | 0.0 /100 | #296 | Tragic 5.5% |
| Yaqui | 0.0 /100 | #297 | Tragic 5.5% |
| Immigrants | West Indies | 0.0 /100 | #298 | Tragic 5.6% |
| Guyanese | 0.0 /100 | #299 | Tragic 5.6% |
| Zimbabweans | 0.0 /100 | #300 | Tragic 5.6% |
| Hispanics or Latinos | 0.0 /100 | #301 | Tragic 5.6% |
| Guatemalans | 0.0 /100 | #302 | Tragic 5.6% |
Demographics Similar to Bangladeshis by Unemployment Among Seniors over 65 years
In terms of unemployment among seniors over 65 years, the demographic groups most similar to Bangladeshis are Korean (5.2%, a difference of 0.030%), Immigrants from Egypt (5.2%, a difference of 0.040%), Somali (5.2%, a difference of 0.050%), Immigrants from Denmark (5.2%, a difference of 0.050%), and Sioux (5.2%, a difference of 0.050%).
| Demographics | Rating | Rank | Unemployment Among Seniors over 65 years |
| Panamanians | 43.0 /100 | #182 | Average 5.2% |
| Immigrants | Western Asia | 42.1 /100 | #183 | Average 5.2% |
| Immigrants | Serbia | 41.6 /100 | #184 | Average 5.2% |
| Immigrants | Iran | 36.0 /100 | #185 | Fair 5.2% |
| Americans | 35.1 /100 | #186 | Fair 5.2% |
| Somalis | 33.5 /100 | #187 | Fair 5.2% |
| Immigrants | Egypt | 33.2 /100 | #188 | Fair 5.2% |
| Bangladeshis | 32.3 /100 | #189 | Fair 5.2% |
| Koreans | 31.6 /100 | #190 | Fair 5.2% |
| Immigrants | Denmark | 31.0 /100 | #191 | Fair 5.2% |
| Sioux | 30.8 /100 | #192 | Fair 5.2% |
| Immigrants | Africa | 29.6 /100 | #193 | Fair 5.2% |
| Argentineans | 29.1 /100 | #194 | Fair 5.2% |
| Costa Ricans | 27.0 /100 | #195 | Fair 5.2% |
| Immigrants | Poland | 24.3 /100 | #196 | Fair 5.2% |