Central American vs Creek Unemployment Among Ages 60 to 64 years
COMPARE
Central American
Creek
Unemployment Among Ages 60 to 64 years
Unemployment Among Ages 60 to 64 years Comparison
Central Americans
Creek
5.2%
UNEMPLOYMENT AMONG AGES 60 TO 64 YEARS
0.0/ 100
METRIC RATING
276th/ 347
METRIC RANK
4.6%
UNEMPLOYMENT AMONG AGES 60 TO 64 YEARS
99.6/ 100
METRIC RATING
69th/ 347
METRIC RANK
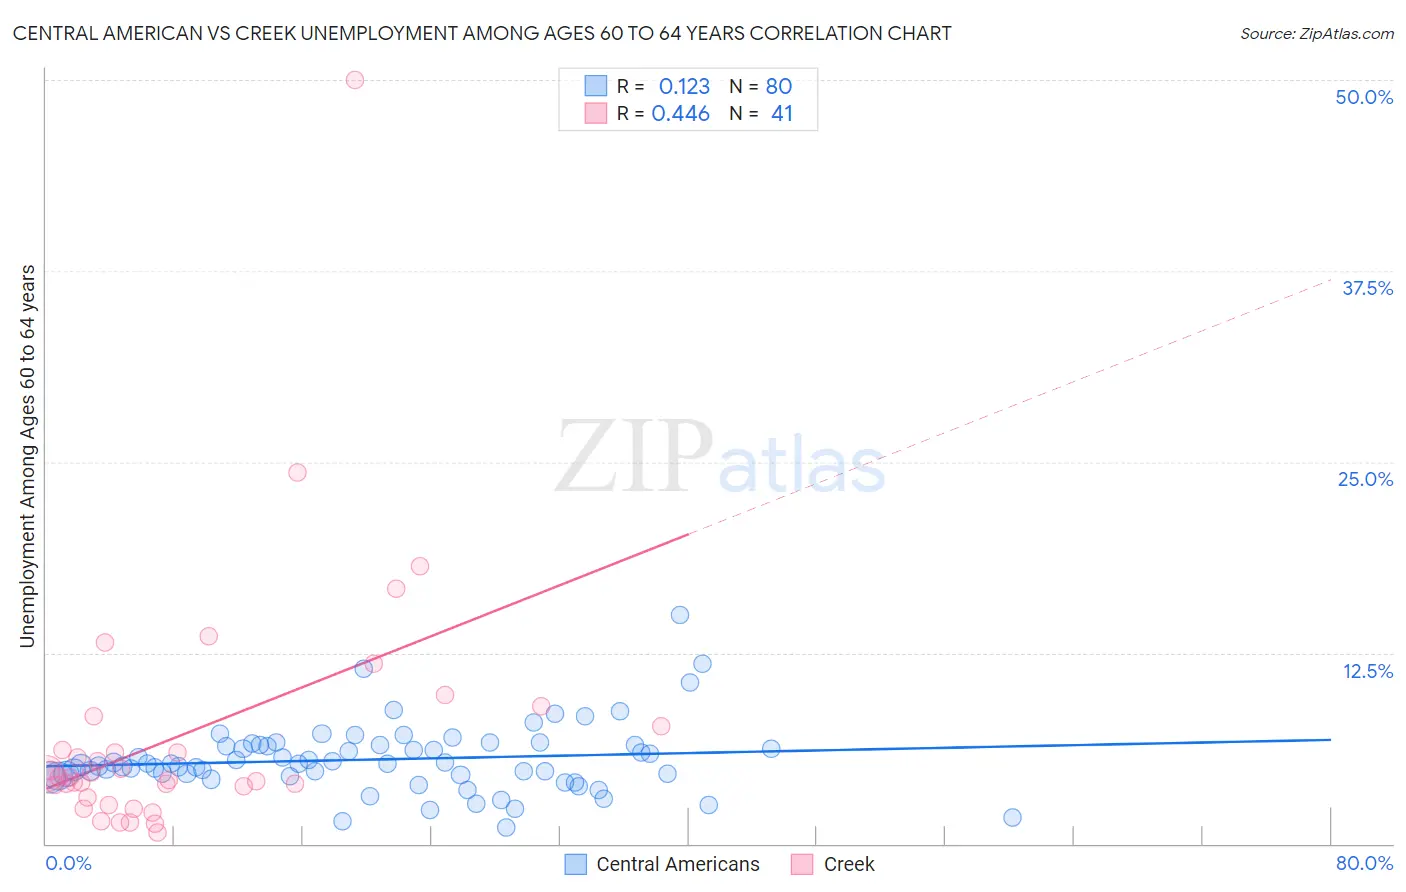
Central American vs Creek Unemployment Among Ages 60 to 64 years Correlation Chart
The statistical analysis conducted on geographies consisting of 436,480,787 people shows a poor positive correlation between the proportion of Central Americans and unemployment rate among population between the ages 60 and 64 in the United States with a correlation coefficient (R) of 0.123 and weighted average of 5.2%. Similarly, the statistical analysis conducted on geographies consisting of 164,830,409 people shows a moderate positive correlation between the proportion of Creek and unemployment rate among population between the ages 60 and 64 in the United States with a correlation coefficient (R) of 0.446 and weighted average of 4.6%, a difference of 12.2%.
Unemployment Among Ages 60 to 64 years Correlation Summary
| Measurement | Central American | Creek |
| Minimum | 1.1% | 0.70% |
| Maximum | 15.0% | 50.0% |
| Range | 13.9% | 49.3% |
| Mean | 5.5% | 7.2% |
| Median | 5.2% | 4.4% |
| Interquartile 25% (IQ1) | 4.5% | 3.4% |
| Interquartile 75% (IQ3) | 6.4% | 8.0% |
| Interquartile Range (IQR) | 2.0% | 4.6% |
| Standard Deviation (Sample) | 2.3% | 8.5% |
| Standard Deviation (Population) | 2.2% | 8.4% |
Similar Demographics by Unemployment Among Ages 60 to 64 years
Demographics Similar to Central Americans by Unemployment Among Ages 60 to 64 years
In terms of unemployment among ages 60 to 64 years, the demographic groups most similar to Central Americans are Immigrants from Hong Kong (5.2%, a difference of 0.16%), Immigrants from Caribbean (5.2%, a difference of 0.27%), Hopi (5.2%, a difference of 0.30%), Immigrants from Spain (5.2%, a difference of 0.44%), and Haitian (5.2%, a difference of 0.51%).
| Demographics | Rating | Rank | Unemployment Among Ages 60 to 64 years |
| Immigrants | Costa Rica | 0.2 /100 | #269 | Tragic 5.1% |
| Immigrants | Iran | 0.1 /100 | #270 | Tragic 5.1% |
| Israelis | 0.1 /100 | #271 | Tragic 5.2% |
| Haitians | 0.1 /100 | #272 | Tragic 5.2% |
| Immigrants | Spain | 0.1 /100 | #273 | Tragic 5.2% |
| Hopi | 0.1 /100 | #274 | Tragic 5.2% |
| Immigrants | Hong Kong | 0.1 /100 | #275 | Tragic 5.2% |
| Central Americans | 0.0 /100 | #276 | Tragic 5.2% |
| Immigrants | Caribbean | 0.0 /100 | #277 | Tragic 5.2% |
| Guatemalans | 0.0 /100 | #278 | Tragic 5.2% |
| Nepalese | 0.0 /100 | #279 | Tragic 5.2% |
| French American Indians | 0.0 /100 | #280 | Tragic 5.2% |
| Immigrants | Haiti | 0.0 /100 | #281 | Tragic 5.2% |
| Mexicans | 0.0 /100 | #282 | Tragic 5.2% |
| Immigrants | Guatemala | 0.0 /100 | #283 | Tragic 5.3% |
Demographics Similar to Creek by Unemployment Among Ages 60 to 64 years
In terms of unemployment among ages 60 to 64 years, the demographic groups most similar to Creek are Croatian (4.6%, a difference of 0.080%), Immigrants from Laos (4.6%, a difference of 0.10%), Immigrants from Scotland (4.6%, a difference of 0.13%), Hawaiian (4.6%, a difference of 0.15%), and Slavic (4.6%, a difference of 0.16%).
| Demographics | Rating | Rank | Unemployment Among Ages 60 to 64 years |
| Senegalese | 99.7 /100 | #62 | Exceptional 4.6% |
| Czechoslovakians | 99.7 /100 | #63 | Exceptional 4.6% |
| Immigrants | Middle Africa | 99.7 /100 | #64 | Exceptional 4.6% |
| Jordanians | 99.7 /100 | #65 | Exceptional 4.6% |
| Hawaiians | 99.6 /100 | #66 | Exceptional 4.6% |
| Immigrants | Scotland | 99.6 /100 | #67 | Exceptional 4.6% |
| Immigrants | Laos | 99.6 /100 | #68 | Exceptional 4.6% |
| Creek | 99.6 /100 | #69 | Exceptional 4.6% |
| Croatians | 99.5 /100 | #70 | Exceptional 4.6% |
| Slavs | 99.5 /100 | #71 | Exceptional 4.6% |
| Tongans | 99.5 /100 | #72 | Exceptional 4.6% |
| Immigrants | Eastern Africa | 99.5 /100 | #73 | Exceptional 4.6% |
| Northern Europeans | 99.3 /100 | #74 | Exceptional 4.6% |
| Potawatomi | 99.3 /100 | #75 | Exceptional 4.6% |
| Slovaks | 99.3 /100 | #76 | Exceptional 4.6% |