Central American vs Irish Unemployment Among Ages 25 to 29 years
COMPARE
Central American
Irish
Unemployment Among Ages 25 to 29 years
Unemployment Among Ages 25 to 29 years Comparison
Central Americans
Irish
7.0%
UNEMPLOYMENT AMONG AGES 25 TO 29 YEARS
3.0/ 100
METRIC RATING
231st/ 347
METRIC RANK
6.7%
UNEMPLOYMENT AMONG AGES 25 TO 29 YEARS
32.8/ 100
METRIC RATING
188th/ 347
METRIC RANK
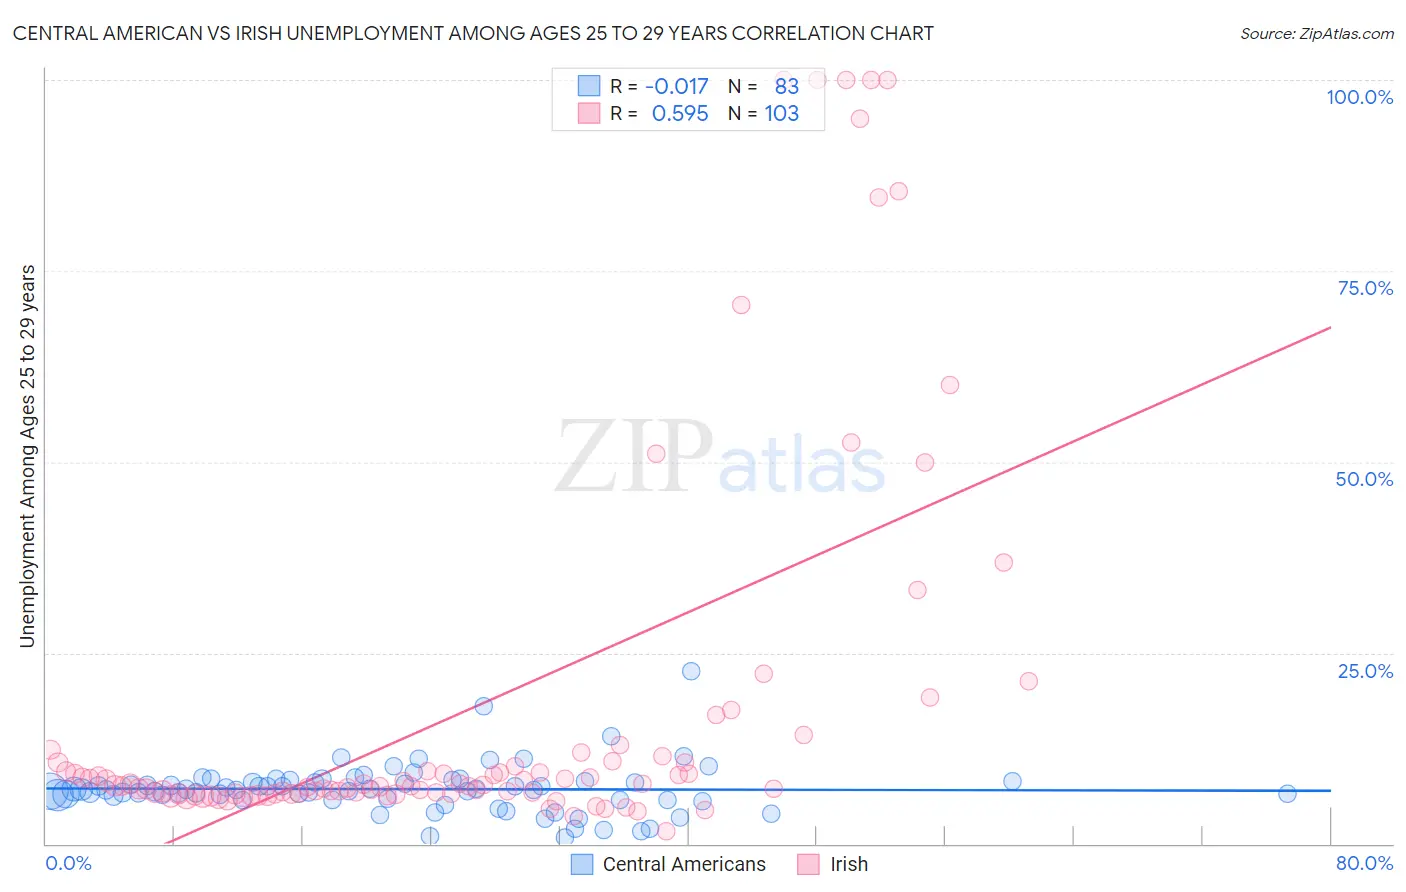
Central American vs Irish Unemployment Among Ages 25 to 29 years Correlation Chart
The statistical analysis conducted on geographies consisting of 469,203,667 people shows no correlation between the proportion of Central Americans and unemployment rate among population between the ages 25 and 29 in the United States with a correlation coefficient (R) of -0.017 and weighted average of 7.0%. Similarly, the statistical analysis conducted on geographies consisting of 510,561,409 people shows a substantial positive correlation between the proportion of Irish and unemployment rate among population between the ages 25 and 29 in the United States with a correlation coefficient (R) of 0.595 and weighted average of 6.7%, a difference of 4.2%.
Unemployment Among Ages 25 to 29 years Correlation Summary
| Measurement | Central American | Irish |
| Minimum | 0.90% | 1.7% |
| Maximum | 22.6% | 100.0% |
| Range | 21.7% | 98.3% |
| Mean | 7.2% | 17.9% |
| Median | 7.1% | 7.6% |
| Interquartile 25% (IQ1) | 5.8% | 6.6% |
| Interquartile 75% (IQ3) | 8.2% | 10.8% |
| Interquartile Range (IQR) | 2.4% | 4.3% |
| Standard Deviation (Sample) | 3.2% | 25.5% |
| Standard Deviation (Population) | 3.2% | 25.4% |
Similar Demographics by Unemployment Among Ages 25 to 29 years
Demographics Similar to Central Americans by Unemployment Among Ages 25 to 29 years
In terms of unemployment among ages 25 to 29 years, the demographic groups most similar to Central Americans are Spanish American (7.0%, a difference of 0.15%), Immigrants from El Salvador (7.0%, a difference of 0.29%), Immigrants from Honduras (7.0%, a difference of 0.34%), French Canadian (7.0%, a difference of 0.36%), and Bermudan (7.0%, a difference of 0.37%).
| Demographics | Rating | Rank | Unemployment Among Ages 25 to 29 years |
| Immigrants | Immigrants | 6.2 /100 | #224 | Tragic 6.9% |
| Japanese | 5.4 /100 | #225 | Tragic 6.9% |
| Immigrants | Liberia | 4.8 /100 | #226 | Tragic 7.0% |
| Salvadorans | 4.4 /100 | #227 | Tragic 7.0% |
| Immigrants | Panama | 4.2 /100 | #228 | Tragic 7.0% |
| Bermudans | 3.8 /100 | #229 | Tragic 7.0% |
| Immigrants | El Salvador | 3.6 /100 | #230 | Tragic 7.0% |
| Central Americans | 3.0 /100 | #231 | Tragic 7.0% |
| Spanish Americans | 2.7 /100 | #232 | Tragic 7.0% |
| Immigrants | Honduras | 2.4 /100 | #233 | Tragic 7.0% |
| French Canadians | 2.4 /100 | #234 | Tragic 7.0% |
| Panamanians | 2.1 /100 | #235 | Tragic 7.0% |
| Cape Verdeans | 1.9 /100 | #236 | Tragic 7.0% |
| Puget Sound Salish | 1.8 /100 | #237 | Tragic 7.1% |
| Hondurans | 1.8 /100 | #238 | Tragic 7.1% |
Demographics Similar to Irish by Unemployment Among Ages 25 to 29 years
In terms of unemployment among ages 25 to 29 years, the demographic groups most similar to Irish are Immigrants from South America (6.7%, a difference of 0.020%), Argentinean (6.7%, a difference of 0.050%), Immigrants from Iran (6.7%, a difference of 0.11%), Moroccan (6.7%, a difference of 0.21%), and Korean (6.7%, a difference of 0.25%).
| Demographics | Rating | Rank | Unemployment Among Ages 25 to 29 years |
| Immigrants | Western Europe | 41.1 /100 | #181 | Average 6.7% |
| Czechoslovakians | 40.7 /100 | #182 | Average 6.7% |
| Immigrants | Scotland | 39.6 /100 | #183 | Fair 6.7% |
| Immigrants | Costa Rica | 38.3 /100 | #184 | Fair 6.7% |
| Moroccans | 35.9 /100 | #185 | Fair 6.7% |
| Immigrants | Iran | 34.4 /100 | #186 | Fair 6.7% |
| Immigrants | South America | 33.0 /100 | #187 | Fair 6.7% |
| Irish | 32.8 /100 | #188 | Fair 6.7% |
| Argentineans | 32.1 /100 | #189 | Fair 6.7% |
| Koreans | 29.3 /100 | #190 | Fair 6.7% |
| Chickasaw | 28.7 /100 | #191 | Fair 6.7% |
| Immigrants | Ukraine | 28.6 /100 | #192 | Fair 6.7% |
| Alsatians | 28.1 /100 | #193 | Fair 6.7% |
| Immigrants | Greece | 28.0 /100 | #194 | Fair 6.7% |
| Immigrants | Western Asia | 27.3 /100 | #195 | Fair 6.7% |