Cambodian vs Irish Unemployment Among Ages 25 to 29 years
COMPARE
Cambodian
Irish
Unemployment Among Ages 25 to 29 years
Unemployment Among Ages 25 to 29 years Comparison
Cambodians
Irish
5.8%
UNEMPLOYMENT AMONG AGES 25 TO 29 YEARS
100.0/ 100
METRIC RATING
11th/ 347
METRIC RANK
6.7%
UNEMPLOYMENT AMONG AGES 25 TO 29 YEARS
32.8/ 100
METRIC RATING
188th/ 347
METRIC RANK
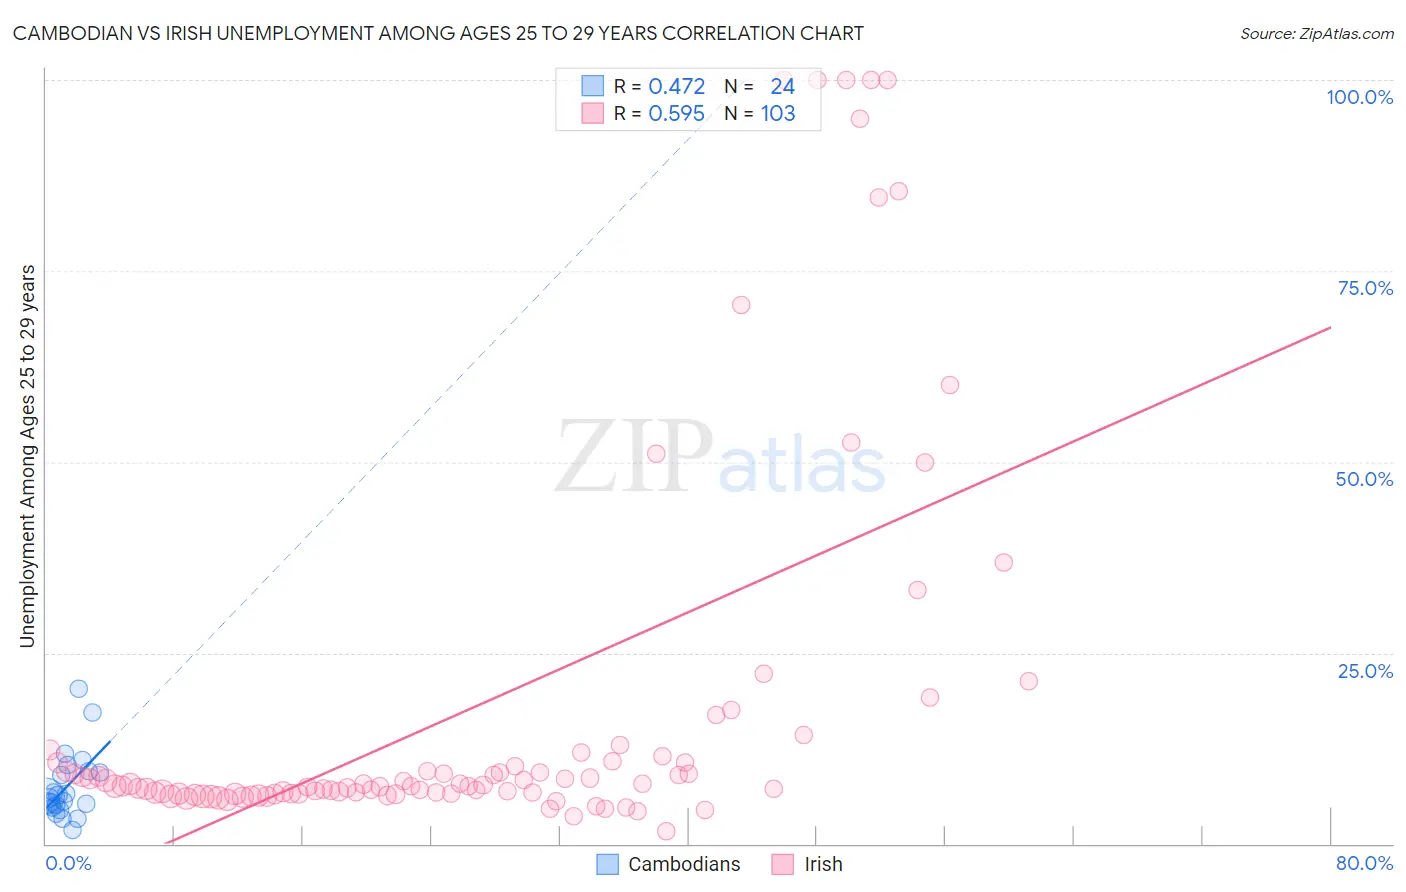
Cambodian vs Irish Unemployment Among Ages 25 to 29 years Correlation Chart
The statistical analysis conducted on geographies consisting of 101,290,377 people shows a moderate positive correlation between the proportion of Cambodians and unemployment rate among population between the ages 25 and 29 in the United States with a correlation coefficient (R) of 0.472 and weighted average of 5.8%. Similarly, the statistical analysis conducted on geographies consisting of 510,561,409 people shows a substantial positive correlation between the proportion of Irish and unemployment rate among population between the ages 25 and 29 in the United States with a correlation coefficient (R) of 0.595 and weighted average of 6.7%, a difference of 15.0%.
Unemployment Among Ages 25 to 29 years Correlation Summary
| Measurement | Cambodian | Irish |
| Minimum | 1.8% | 1.7% |
| Maximum | 20.3% | 100.0% |
| Range | 18.5% | 98.3% |
| Mean | 7.4% | 17.9% |
| Median | 6.1% | 7.6% |
| Interquartile 25% (IQ1) | 4.9% | 6.6% |
| Interquartile 75% (IQ3) | 9.4% | 10.8% |
| Interquartile Range (IQR) | 4.5% | 4.3% |
| Standard Deviation (Sample) | 4.3% | 25.5% |
| Standard Deviation (Population) | 4.3% | 25.4% |
Similar Demographics by Unemployment Among Ages 25 to 29 years
Demographics Similar to Cambodians by Unemployment Among Ages 25 to 29 years
In terms of unemployment among ages 25 to 29 years, the demographic groups most similar to Cambodians are Okinawan (5.9%, a difference of 0.12%), Immigrants from Bolivia (5.9%, a difference of 0.15%), Immigrants from Kuwait (5.9%, a difference of 0.78%), Immigrants from Sudan (5.8%, a difference of 1.1%), and Cuban (5.9%, a difference of 1.1%).
| Demographics | Rating | Rank | Unemployment Among Ages 25 to 29 years |
| Immigrants | Cuba | 100.0 /100 | #4 | Exceptional 5.6% |
| Somalis | 100.0 /100 | #5 | Exceptional 5.6% |
| Hmong | 100.0 /100 | #6 | Exceptional 5.7% |
| Immigrants | India | 100.0 /100 | #7 | Exceptional 5.7% |
| Immigrants | Bosnia and Herzegovina | 100.0 /100 | #8 | Exceptional 5.7% |
| Immigrants | Nepal | 100.0 /100 | #9 | Exceptional 5.7% |
| Immigrants | Sudan | 100.0 /100 | #10 | Exceptional 5.8% |
| Cambodians | 100.0 /100 | #11 | Exceptional 5.8% |
| Okinawans | 100.0 /100 | #12 | Exceptional 5.9% |
| Immigrants | Bolivia | 100.0 /100 | #13 | Exceptional 5.9% |
| Immigrants | Kuwait | 99.9 /100 | #14 | Exceptional 5.9% |
| Cubans | 99.9 /100 | #15 | Exceptional 5.9% |
| Immigrants | Bulgaria | 99.9 /100 | #16 | Exceptional 5.9% |
| Bolivians | 99.9 /100 | #17 | Exceptional 5.9% |
| Immigrants | Singapore | 99.9 /100 | #18 | Exceptional 5.9% |
Demographics Similar to Irish by Unemployment Among Ages 25 to 29 years
In terms of unemployment among ages 25 to 29 years, the demographic groups most similar to Irish are Immigrants from South America (6.7%, a difference of 0.020%), Argentinean (6.7%, a difference of 0.050%), Immigrants from Iran (6.7%, a difference of 0.11%), Moroccan (6.7%, a difference of 0.21%), and Korean (6.7%, a difference of 0.25%).
| Demographics | Rating | Rank | Unemployment Among Ages 25 to 29 years |
| Immigrants | Western Europe | 41.1 /100 | #181 | Average 6.7% |
| Czechoslovakians | 40.7 /100 | #182 | Average 6.7% |
| Immigrants | Scotland | 39.6 /100 | #183 | Fair 6.7% |
| Immigrants | Costa Rica | 38.3 /100 | #184 | Fair 6.7% |
| Moroccans | 35.9 /100 | #185 | Fair 6.7% |
| Immigrants | Iran | 34.4 /100 | #186 | Fair 6.7% |
| Immigrants | South America | 33.0 /100 | #187 | Fair 6.7% |
| Irish | 32.8 /100 | #188 | Fair 6.7% |
| Argentineans | 32.1 /100 | #189 | Fair 6.7% |
| Koreans | 29.3 /100 | #190 | Fair 6.7% |
| Chickasaw | 28.7 /100 | #191 | Fair 6.7% |
| Immigrants | Ukraine | 28.6 /100 | #192 | Fair 6.7% |
| Alsatians | 28.1 /100 | #193 | Fair 6.7% |
| Immigrants | Greece | 28.0 /100 | #194 | Fair 6.7% |
| Immigrants | Western Asia | 27.3 /100 | #195 | Fair 6.7% |