Central American vs Immigrants from Belarus Unemployment Among Ages 30 to 34 years
COMPARE
Central American
Immigrants from Belarus
Unemployment Among Ages 30 to 34 years
Unemployment Among Ages 30 to 34 years Comparison
Central Americans
Immigrants from Belarus
5.9%
UNEMPLOYMENT AMONG AGES 30 TO 34 YEARS
0.6/ 100
METRIC RATING
237th/ 347
METRIC RANK
5.4%
UNEMPLOYMENT AMONG AGES 30 TO 34 YEARS
62.7/ 100
METRIC RATING
158th/ 347
METRIC RANK
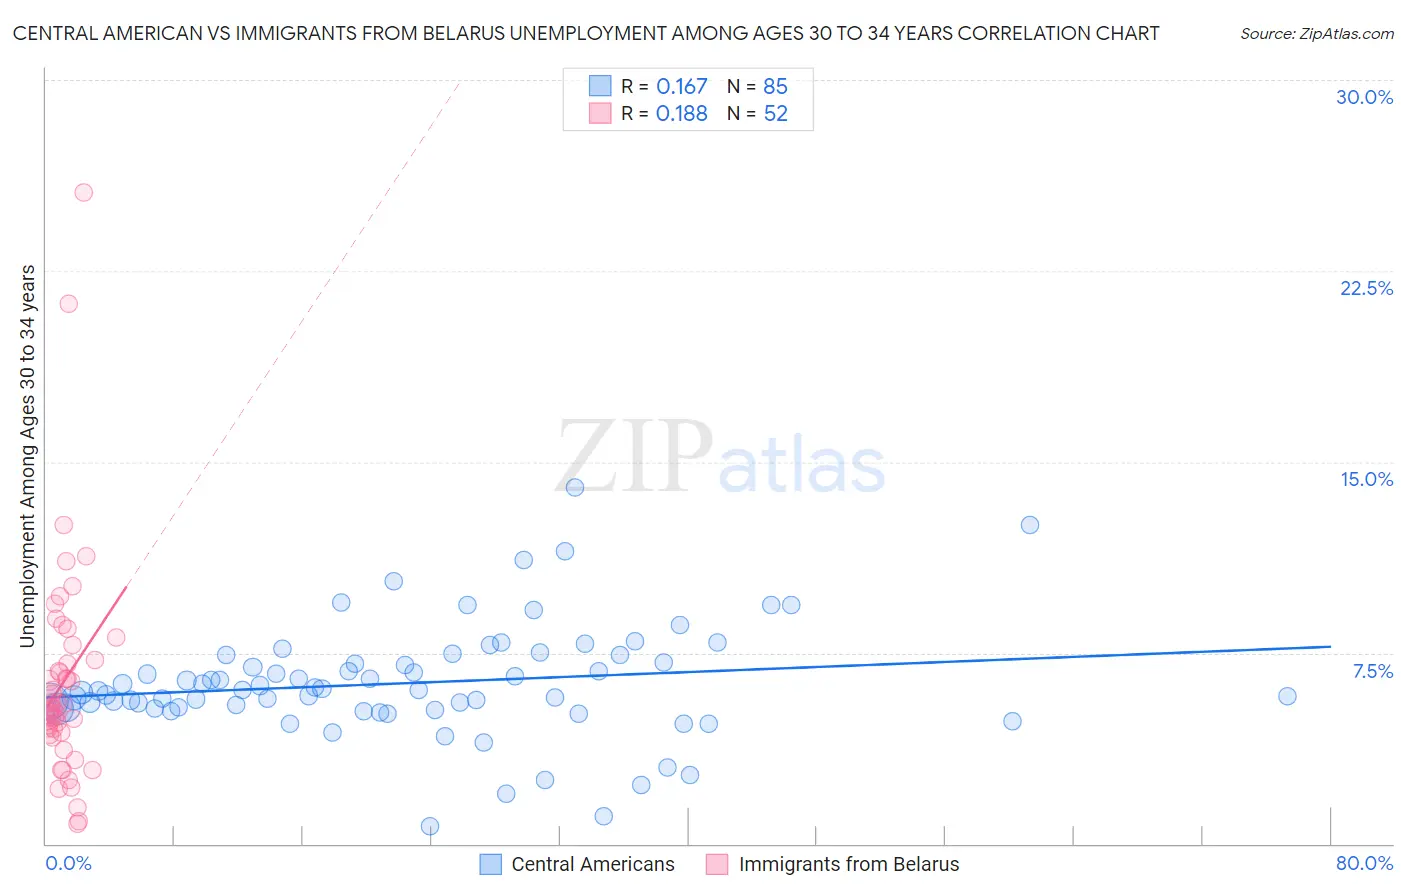
Central American vs Immigrants from Belarus Unemployment Among Ages 30 to 34 years Correlation Chart
The statistical analysis conducted on geographies consisting of 462,932,276 people shows a poor positive correlation between the proportion of Central Americans and unemployment rate among population between the ages 30 and 34 in the United States with a correlation coefficient (R) of 0.167 and weighted average of 5.9%. Similarly, the statistical analysis conducted on geographies consisting of 146,773,968 people shows a poor positive correlation between the proportion of Immigrants from Belarus and unemployment rate among population between the ages 30 and 34 in the United States with a correlation coefficient (R) of 0.188 and weighted average of 5.4%, a difference of 9.8%.
Unemployment Among Ages 30 to 34 years Correlation Summary
| Measurement | Central American | Immigrants from Belarus |
| Minimum | 0.70% | 0.80% |
| Maximum | 14.0% | 25.6% |
| Range | 13.3% | 24.8% |
| Mean | 6.3% | 6.4% |
| Median | 6.0% | 5.4% |
| Interquartile 25% (IQ1) | 5.3% | 4.3% |
| Interquartile 75% (IQ3) | 7.3% | 7.5% |
| Interquartile Range (IQR) | 2.0% | 3.2% |
| Standard Deviation (Sample) | 2.2% | 4.3% |
| Standard Deviation (Population) | 2.2% | 4.3% |
Similar Demographics by Unemployment Among Ages 30 to 34 years
Demographics Similar to Central Americans by Unemployment Among Ages 30 to 34 years
In terms of unemployment among ages 30 to 34 years, the demographic groups most similar to Central Americans are Mexican American Indian (5.9%, a difference of 0.090%), Native Hawaiian (5.9%, a difference of 0.17%), Immigrants from Nigeria (6.0%, a difference of 0.17%), Yaqui (5.9%, a difference of 0.29%), and Portuguese (5.9%, a difference of 0.41%).
| Demographics | Rating | Rank | Unemployment Among Ages 30 to 34 years |
| Hawaiians | 1.2 /100 | #230 | Tragic 5.9% |
| Japanese | 1.1 /100 | #231 | Tragic 5.9% |
| Iroquois | 1.0 /100 | #232 | Tragic 5.9% |
| Nepalese | 0.8 /100 | #233 | Tragic 5.9% |
| Portuguese | 0.8 /100 | #234 | Tragic 5.9% |
| Yaqui | 0.7 /100 | #235 | Tragic 5.9% |
| Native Hawaiians | 0.7 /100 | #236 | Tragic 5.9% |
| Central Americans | 0.6 /100 | #237 | Tragic 5.9% |
| Mexican American Indians | 0.6 /100 | #238 | Tragic 5.9% |
| Immigrants | Nigeria | 0.6 /100 | #239 | Tragic 6.0% |
| Salvadorans | 0.5 /100 | #240 | Tragic 6.0% |
| Immigrants | El Salvador | 0.5 /100 | #241 | Tragic 6.0% |
| Guatemalans | 0.4 /100 | #242 | Tragic 6.0% |
| Immigrants | Liberia | 0.4 /100 | #243 | Tragic 6.0% |
| Immigrants | Micronesia | 0.3 /100 | #244 | Tragic 6.0% |
Demographics Similar to Immigrants from Belarus by Unemployment Among Ages 30 to 34 years
In terms of unemployment among ages 30 to 34 years, the demographic groups most similar to Immigrants from Belarus are Albanian (5.4%, a difference of 0.070%), Czechoslovakian (5.4%, a difference of 0.080%), Immigrants from Croatia (5.4%, a difference of 0.12%), Immigrants from Scotland (5.4%, a difference of 0.25%), and Immigrants from Hungary (5.4%, a difference of 0.26%).
| Demographics | Rating | Rank | Unemployment Among Ages 30 to 34 years |
| Immigrants | Oceania | 68.1 /100 | #151 | Good 5.4% |
| Lebanese | 67.2 /100 | #152 | Good 5.4% |
| Immigrants | South Eastern Asia | 66.5 /100 | #153 | Good 5.4% |
| South Africans | 66.5 /100 | #154 | Good 5.4% |
| Immigrants | Hungary | 66.1 /100 | #155 | Good 5.4% |
| Czechoslovakians | 63.7 /100 | #156 | Good 5.4% |
| Albanians | 63.7 /100 | #157 | Good 5.4% |
| Immigrants | Belarus | 62.7 /100 | #158 | Good 5.4% |
| Immigrants | Croatia | 61.0 /100 | #159 | Good 5.4% |
| Immigrants | Scotland | 59.3 /100 | #160 | Average 5.4% |
| Austrians | 59.0 /100 | #161 | Average 5.4% |
| Brazilians | 58.2 /100 | #162 | Average 5.4% |
| Arabs | 57.7 /100 | #163 | Average 5.4% |
| Basques | 57.3 /100 | #164 | Average 5.4% |
| Welsh | 56.3 /100 | #165 | Average 5.4% |