Central American vs Immigrants from Laos Unemployment Among Seniors over 75 years
COMPARE
Central American
Immigrants from Laos
Unemployment Among Seniors over 75 years
Unemployment Among Seniors over 75 years Comparison
Central Americans
Immigrants from Laos
8.8%
UNEMPLOYMENT AMONG SENIORS OVER 75 YEARS
43.3/ 100
METRIC RATING
177th/ 347
METRIC RANK
8.9%
UNEMPLOYMENT AMONG SENIORS OVER 75 YEARS
26.3/ 100
METRIC RATING
197th/ 347
METRIC RANK
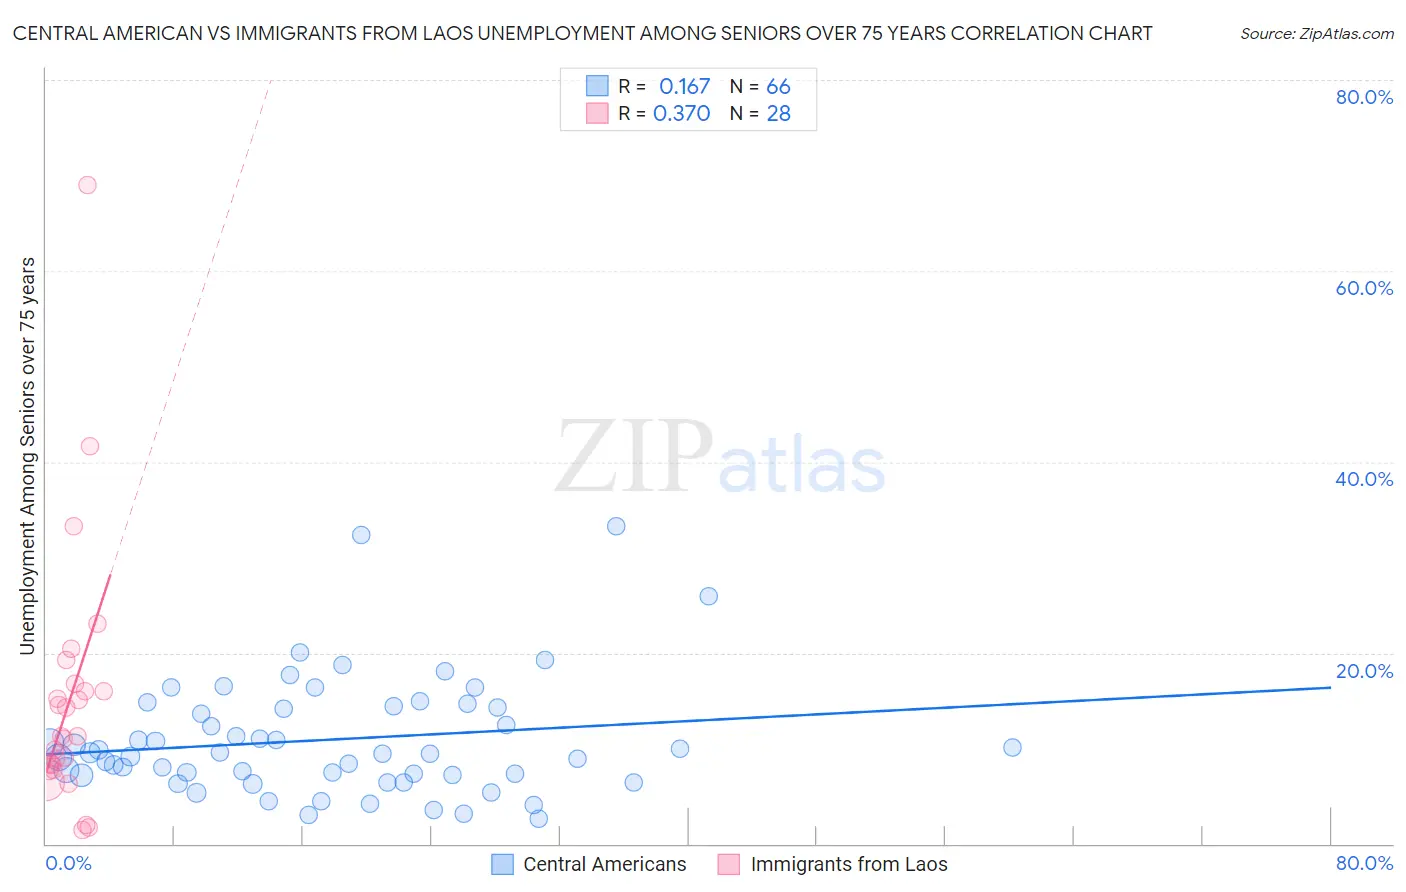
Central American vs Immigrants from Laos Unemployment Among Seniors over 75 years Correlation Chart
The statistical analysis conducted on geographies consisting of 227,035,264 people shows a poor positive correlation between the proportion of Central Americans and unemployment rate among seniors over the age of 75 in the United States with a correlation coefficient (R) of 0.167 and weighted average of 8.8%. Similarly, the statistical analysis conducted on geographies consisting of 123,851,723 people shows a mild positive correlation between the proportion of Immigrants from Laos and unemployment rate among seniors over the age of 75 in the United States with a correlation coefficient (R) of 0.370 and weighted average of 8.9%, a difference of 1.0%.
Unemployment Among Seniors over 75 years Correlation Summary
| Measurement | Central American | Immigrants from Laos |
| Minimum | 2.6% | 1.4% |
| Maximum | 33.3% | 69.0% |
| Range | 30.7% | 67.6% |
| Mean | 10.9% | 15.2% |
| Median | 9.4% | 11.2% |
| Interquartile 25% (IQ1) | 7.2% | 8.0% |
| Interquartile 75% (IQ3) | 14.3% | 16.4% |
| Interquartile Range (IQR) | 7.1% | 8.4% |
| Standard Deviation (Sample) | 6.1% | 13.7% |
| Standard Deviation (Population) | 6.1% | 13.5% |
Demographics Similar to Central Americans and Immigrants from Laos by Unemployment Among Seniors over 75 years
In terms of unemployment among seniors over 75 years, the demographic groups most similar to Central Americans are West Indian (8.8%, a difference of 0.080%), Immigrants from Italy (8.8%, a difference of 0.090%), Immigrants from Somalia (8.8%, a difference of 0.090%), Immigrants from Thailand (8.8%, a difference of 0.17%), and Guatemalan (8.8%, a difference of 0.21%). Similarly, the demographic groups most similar to Immigrants from Laos are Immigrants from Jamaica (8.9%, a difference of 0.10%), Okinawan (8.8%, a difference of 0.17%), Maltese (8.8%, a difference of 0.19%), Immigrants from Guyana (8.8%, a difference of 0.24%), and Immigrants from Kenya (8.8%, a difference of 0.35%).
| Demographics | Rating | Rank | Unemployment Among Seniors over 75 years |
| Central Americans | 43.3 /100 | #177 | Average 8.8% |
| West Indians | 41.9 /100 | #178 | Average 8.8% |
| Immigrants | Italy | 41.7 /100 | #179 | Average 8.8% |
| Immigrants | Somalia | 41.7 /100 | #180 | Average 8.8% |
| Immigrants | Thailand | 40.2 /100 | #181 | Average 8.8% |
| Guatemalans | 39.5 /100 | #182 | Fair 8.8% |
| Immigrants | Afghanistan | 38.2 /100 | #183 | Fair 8.8% |
| Immigrants | Micronesia | 37.2 /100 | #184 | Fair 8.8% |
| Choctaw | 37.1 /100 | #185 | Fair 8.8% |
| Immigrants | Ethiopia | 36.2 /100 | #186 | Fair 8.8% |
| Immigrants | Europe | 35.2 /100 | #187 | Fair 8.8% |
| Immigrants | Eastern Europe | 34.7 /100 | #188 | Fair 8.8% |
| Immigrants | Haiti | 34.7 /100 | #189 | Fair 8.8% |
| Mexican American Indians | 34.7 /100 | #190 | Fair 8.8% |
| Estonians | 33.3 /100 | #191 | Fair 8.8% |
| Immigrants | Kenya | 31.8 /100 | #192 | Fair 8.8% |
| Immigrants | Guyana | 29.9 /100 | #193 | Fair 8.8% |
| Maltese | 29.2 /100 | #194 | Fair 8.8% |
| Okinawans | 28.9 /100 | #195 | Fair 8.8% |
| Immigrants | Jamaica | 27.7 /100 | #196 | Fair 8.9% |
| Immigrants | Laos | 26.3 /100 | #197 | Fair 8.9% |