Central American vs Immigrants from Pakistan Unemployment Among Seniors over 75 years
COMPARE
Central American
Immigrants from Pakistan
Unemployment Among Seniors over 75 years
Unemployment Among Seniors over 75 years Comparison
Central Americans
Immigrants from Pakistan
8.8%
UNEMPLOYMENT AMONG SENIORS OVER 75 YEARS
43.3/ 100
METRIC RATING
177th/ 347
METRIC RANK
8.6%
UNEMPLOYMENT AMONG SENIORS OVER 75 YEARS
79.7/ 100
METRIC RATING
154th/ 347
METRIC RANK
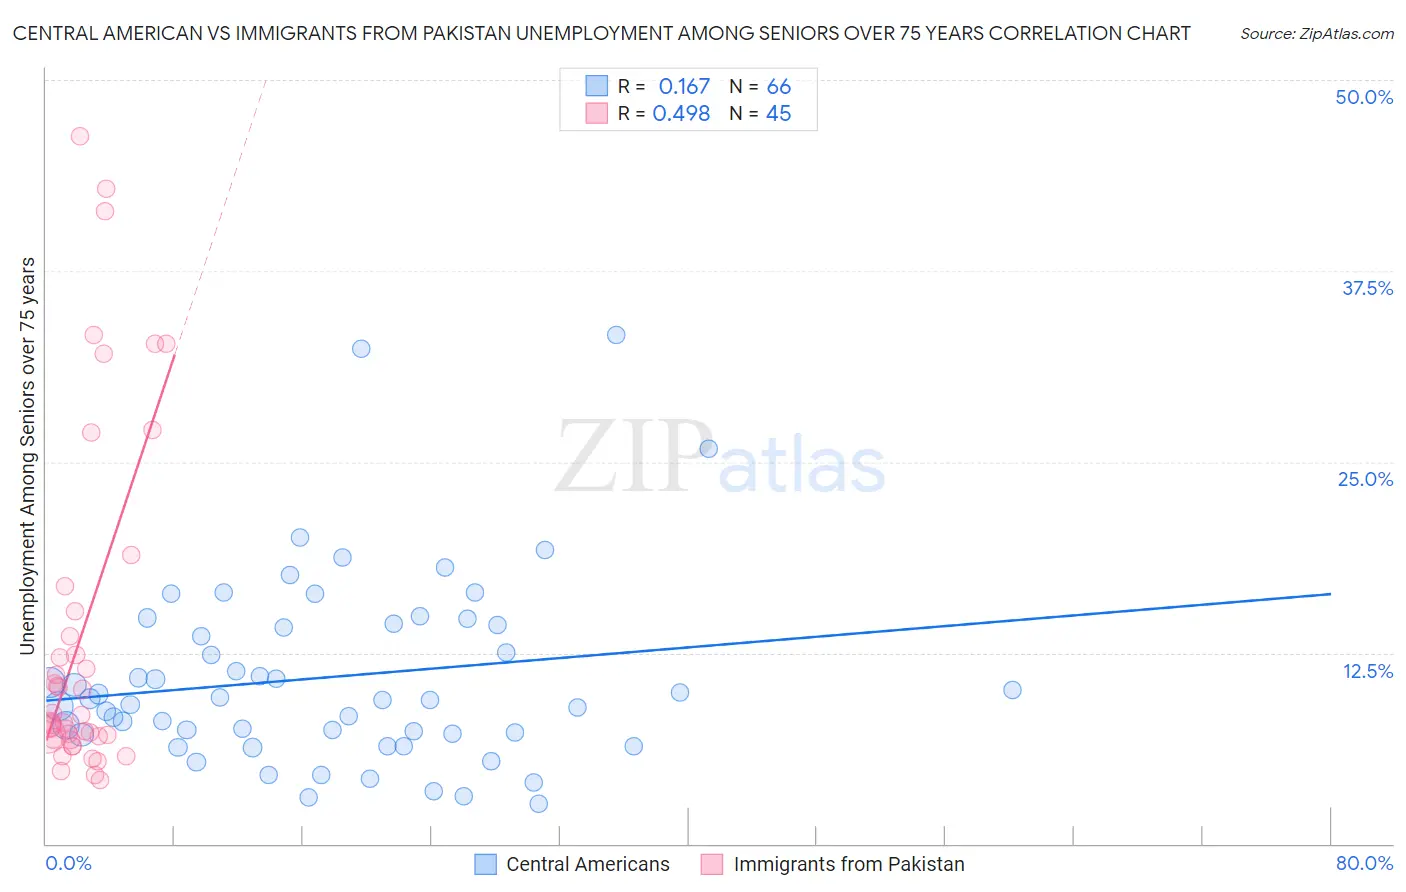
Central American vs Immigrants from Pakistan Unemployment Among Seniors over 75 years Correlation Chart
The statistical analysis conducted on geographies consisting of 227,035,264 people shows a poor positive correlation between the proportion of Central Americans and unemployment rate among seniors over the age of 75 in the United States with a correlation coefficient (R) of 0.167 and weighted average of 8.8%. Similarly, the statistical analysis conducted on geographies consisting of 164,769,281 people shows a moderate positive correlation between the proportion of Immigrants from Pakistan and unemployment rate among seniors over the age of 75 in the United States with a correlation coefficient (R) of 0.498 and weighted average of 8.6%, a difference of 2.2%.
Unemployment Among Seniors over 75 years Correlation Summary
| Measurement | Central American | Immigrants from Pakistan |
| Minimum | 2.6% | 4.2% |
| Maximum | 33.3% | 46.3% |
| Range | 30.7% | 42.1% |
| Mean | 10.9% | 14.0% |
| Median | 9.4% | 8.4% |
| Interquartile 25% (IQ1) | 7.2% | 7.0% |
| Interquartile 75% (IQ3) | 14.3% | 16.1% |
| Interquartile Range (IQR) | 7.1% | 9.1% |
| Standard Deviation (Sample) | 6.1% | 11.5% |
| Standard Deviation (Population) | 6.1% | 11.3% |
Similar Demographics by Unemployment Among Seniors over 75 years
Demographics Similar to Central Americans by Unemployment Among Seniors over 75 years
In terms of unemployment among seniors over 75 years, the demographic groups most similar to Central Americans are West Indian (8.8%, a difference of 0.080%), Immigrants from Italy (8.8%, a difference of 0.090%), Immigrants from Somalia (8.8%, a difference of 0.090%), Somali (8.8%, a difference of 0.11%), and Immigrants from Thailand (8.8%, a difference of 0.17%).
| Demographics | Rating | Rank | Unemployment Among Seniors over 75 years |
| Zimbabweans | 54.1 /100 | #170 | Average 8.7% |
| Dominicans | 51.9 /100 | #171 | Average 8.7% |
| Immigrants | Immigrants | 51.8 /100 | #172 | Average 8.7% |
| Australians | 50.3 /100 | #173 | Average 8.7% |
| Immigrants | El Salvador | 49.7 /100 | #174 | Average 8.7% |
| Syrians | 49.6 /100 | #175 | Average 8.7% |
| Somalis | 45.3 /100 | #176 | Average 8.8% |
| Central Americans | 43.3 /100 | #177 | Average 8.8% |
| West Indians | 41.9 /100 | #178 | Average 8.8% |
| Immigrants | Italy | 41.7 /100 | #179 | Average 8.8% |
| Immigrants | Somalia | 41.7 /100 | #180 | Average 8.8% |
| Immigrants | Thailand | 40.2 /100 | #181 | Average 8.8% |
| Guatemalans | 39.5 /100 | #182 | Fair 8.8% |
| Immigrants | Afghanistan | 38.2 /100 | #183 | Fair 8.8% |
| Immigrants | Micronesia | 37.2 /100 | #184 | Fair 8.8% |
Demographics Similar to Immigrants from Pakistan by Unemployment Among Seniors over 75 years
In terms of unemployment among seniors over 75 years, the demographic groups most similar to Immigrants from Pakistan are Mongolian (8.6%, a difference of 0.040%), Latvian (8.6%, a difference of 0.070%), Immigrants from Bosnia and Herzegovina (8.6%, a difference of 0.080%), Ecuadorian (8.6%, a difference of 0.10%), and Paiute (8.6%, a difference of 0.25%).
| Demographics | Rating | Rank | Unemployment Among Seniors over 75 years |
| Immigrants | Sierra Leone | 85.6 /100 | #147 | Excellent 8.5% |
| Immigrants | Colombia | 85.6 /100 | #148 | Excellent 8.5% |
| Immigrants | Ecuador | 84.6 /100 | #149 | Excellent 8.5% |
| Paiute | 82.5 /100 | #150 | Excellent 8.6% |
| Immigrants | Bosnia and Herzegovina | 80.6 /100 | #151 | Excellent 8.6% |
| Latvians | 80.5 /100 | #152 | Excellent 8.6% |
| Mongolians | 80.1 /100 | #153 | Excellent 8.6% |
| Immigrants | Pakistan | 79.7 /100 | #154 | Good 8.6% |
| Ecuadorians | 78.5 /100 | #155 | Good 8.6% |
| Immigrants | Bahamas | 76.5 /100 | #156 | Good 8.6% |
| Turks | 76.4 /100 | #157 | Good 8.6% |
| Ethiopians | 75.3 /100 | #158 | Good 8.6% |
| Shoshone | 74.6 /100 | #159 | Good 8.6% |
| Cree | 72.8 /100 | #160 | Good 8.6% |
| Albanians | 72.8 /100 | #161 | Good 8.6% |