Central American vs Immigrants from England Unemployment Among Ages 35 to 44 years
COMPARE
Central American
Immigrants from England
Unemployment Among Ages 35 to 44 years
Unemployment Among Ages 35 to 44 years Comparison
Central Americans
Immigrants from England
5.1%
UNEMPLOYMENT AMONG AGES 35 TO 44 YEARS
0.8/ 100
METRIC RATING
236th/ 347
METRIC RANK
4.6%
UNEMPLOYMENT AMONG AGES 35 TO 44 YEARS
70.5/ 100
METRIC RATING
150th/ 347
METRIC RANK
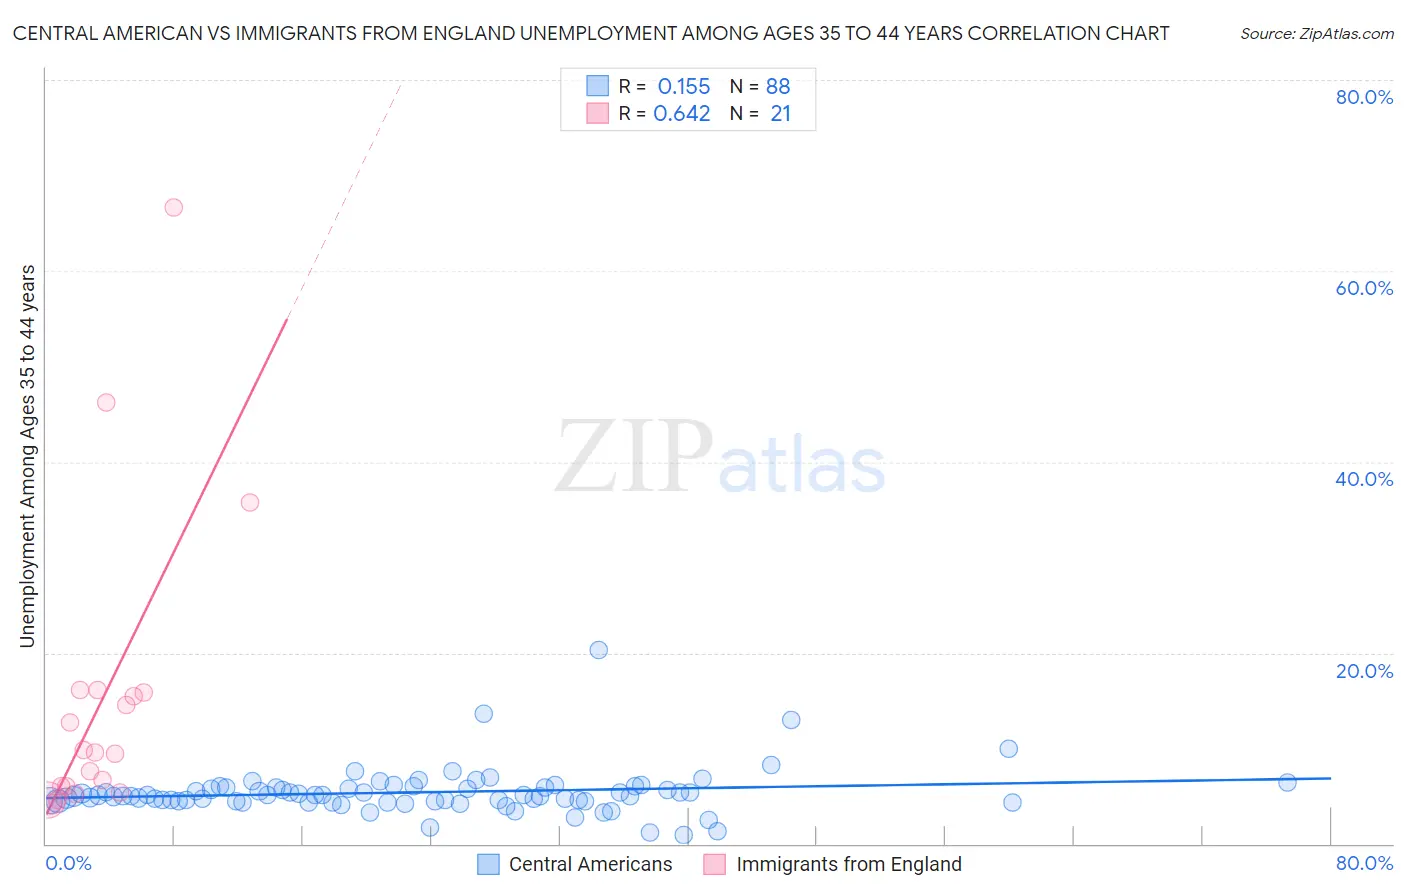
Central American vs Immigrants from England Unemployment Among Ages 35 to 44 years Correlation Chart
The statistical analysis conducted on geographies consisting of 486,165,089 people shows a poor positive correlation between the proportion of Central Americans and unemployment rate among population between the ages 35 and 44 in the United States with a correlation coefficient (R) of 0.155 and weighted average of 5.1%. Similarly, the statistical analysis conducted on geographies consisting of 382,025,174 people shows a significant positive correlation between the proportion of Immigrants from England and unemployment rate among population between the ages 35 and 44 in the United States with a correlation coefficient (R) of 0.642 and weighted average of 4.6%, a difference of 10.2%.
Unemployment Among Ages 35 to 44 years Correlation Summary
| Measurement | Central American | Immigrants from England |
| Minimum | 0.90% | 4.1% |
| Maximum | 20.3% | 66.7% |
| Range | 19.4% | 62.6% |
| Mean | 5.4% | 15.1% |
| Median | 5.0% | 9.5% |
| Interquartile 25% (IQ1) | 4.4% | 5.7% |
| Interquartile 75% (IQ3) | 5.9% | 15.9% |
| Interquartile Range (IQR) | 1.5% | 10.3% |
| Standard Deviation (Sample) | 2.5% | 15.8% |
| Standard Deviation (Population) | 2.4% | 15.4% |
Similar Demographics by Unemployment Among Ages 35 to 44 years
Demographics Similar to Central Americans by Unemployment Among Ages 35 to 44 years
In terms of unemployment among ages 35 to 44 years, the demographic groups most similar to Central Americans are Kiowa (5.1%, a difference of 0.050%), Guamanian/Chamorro (5.1%, a difference of 0.21%), Honduran (5.1%, a difference of 0.22%), Nigerian (5.1%, a difference of 0.28%), and Somali (5.1%, a difference of 0.41%).
| Demographics | Rating | Rank | Unemployment Among Ages 35 to 44 years |
| Immigrants | Cambodia | 1.5 /100 | #229 | Tragic 5.0% |
| Liberians | 1.3 /100 | #230 | Tragic 5.1% |
| Japanese | 1.2 /100 | #231 | Tragic 5.1% |
| Iroquois | 1.2 /100 | #232 | Tragic 5.1% |
| Immigrants | Nigeria | 1.2 /100 | #233 | Tragic 5.1% |
| Portuguese | 1.1 /100 | #234 | Tragic 5.1% |
| Guamanians/Chamorros | 0.9 /100 | #235 | Tragic 5.1% |
| Central Americans | 0.8 /100 | #236 | Tragic 5.1% |
| Kiowa | 0.8 /100 | #237 | Tragic 5.1% |
| Hondurans | 0.7 /100 | #238 | Tragic 5.1% |
| Nigerians | 0.7 /100 | #239 | Tragic 5.1% |
| Somalis | 0.7 /100 | #240 | Tragic 5.1% |
| Immigrants | Honduras | 0.6 /100 | #241 | Tragic 5.1% |
| Delaware | 0.5 /100 | #242 | Tragic 5.1% |
| Salvadorans | 0.4 /100 | #243 | Tragic 5.1% |
Demographics Similar to Immigrants from England by Unemployment Among Ages 35 to 44 years
In terms of unemployment among ages 35 to 44 years, the demographic groups most similar to Immigrants from England are Immigrants from Burma/Myanmar (4.6%, a difference of 0.15%), Slavic (4.6%, a difference of 0.17%), Immigrants from Vietnam (4.6%, a difference of 0.29%), Puget Sound Salish (4.6%, a difference of 0.29%), and Pakistani (4.6%, a difference of 0.29%).
| Demographics | Rating | Rank | Unemployment Among Ages 35 to 44 years |
| Immigrants | Switzerland | 75.5 /100 | #143 | Good 4.6% |
| Immigrants | Russia | 75.4 /100 | #144 | Good 4.6% |
| Immigrants | Eastern Europe | 74.7 /100 | #145 | Good 4.6% |
| Immigrants | Denmark | 74.4 /100 | #146 | Good 4.6% |
| Immigrants | Vietnam | 73.8 /100 | #147 | Good 4.6% |
| Slavs | 72.4 /100 | #148 | Good 4.6% |
| Immigrants | Burma/Myanmar | 72.2 /100 | #149 | Good 4.6% |
| Immigrants | England | 70.5 /100 | #150 | Good 4.6% |
| Puget Sound Salish | 67.1 /100 | #151 | Good 4.6% |
| Pakistanis | 67.1 /100 | #152 | Good 4.6% |
| Immigrants | Brazil | 67.0 /100 | #153 | Good 4.6% |
| Immigrants | Western Europe | 65.5 /100 | #154 | Good 4.6% |
| Whites/Caucasians | 64.9 /100 | #155 | Good 4.6% |
| South Americans | 63.7 /100 | #156 | Good 4.6% |
| Immigrants | Belarus | 63.4 /100 | #157 | Good 4.6% |