Central American vs Immigrants from Singapore Unemployment Among Ages 35 to 44 years
COMPARE
Central American
Immigrants from Singapore
Unemployment Among Ages 35 to 44 years
Unemployment Among Ages 35 to 44 years Comparison
Central Americans
Immigrants from Singapore
5.1%
UNEMPLOYMENT AMONG AGES 35 TO 44 YEARS
0.8/ 100
METRIC RATING
236th/ 347
METRIC RANK
4.1%
UNEMPLOYMENT AMONG AGES 35 TO 44 YEARS
99.9/ 100
METRIC RATING
10th/ 347
METRIC RANK
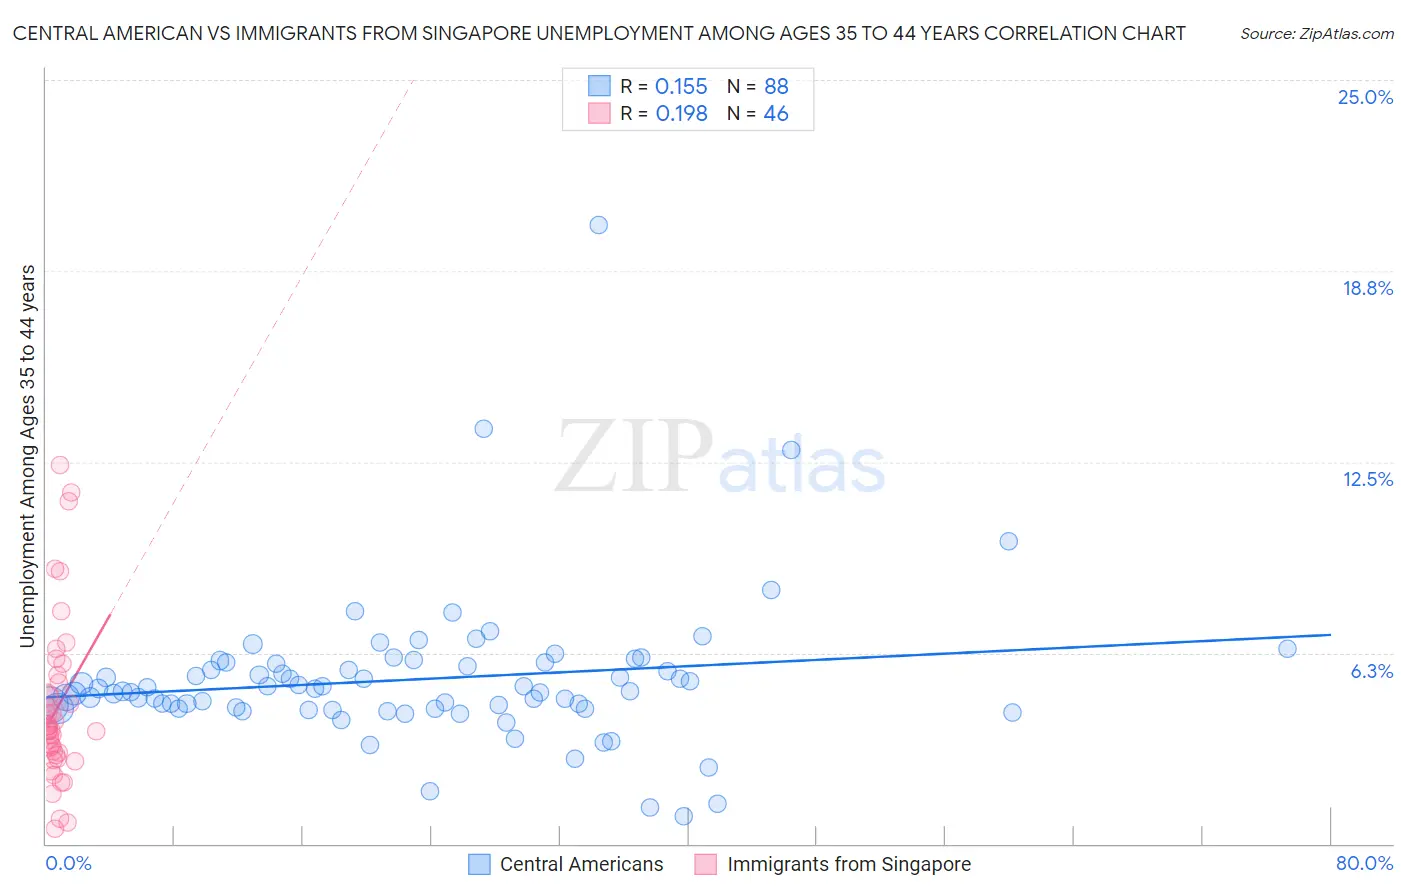
Central American vs Immigrants from Singapore Unemployment Among Ages 35 to 44 years Correlation Chart
The statistical analysis conducted on geographies consisting of 486,165,089 people shows a poor positive correlation between the proportion of Central Americans and unemployment rate among population between the ages 35 and 44 in the United States with a correlation coefficient (R) of 0.155 and weighted average of 5.1%. Similarly, the statistical analysis conducted on geographies consisting of 136,642,747 people shows a poor positive correlation between the proportion of Immigrants from Singapore and unemployment rate among population between the ages 35 and 44 in the United States with a correlation coefficient (R) of 0.198 and weighted average of 4.1%, a difference of 23.1%.
Unemployment Among Ages 35 to 44 years Correlation Summary
| Measurement | Central American | Immigrants from Singapore |
| Minimum | 0.90% | 0.50% |
| Maximum | 20.3% | 12.4% |
| Range | 19.4% | 11.9% |
| Mean | 5.4% | 4.4% |
| Median | 5.0% | 3.7% |
| Interquartile 25% (IQ1) | 4.4% | 2.9% |
| Interquartile 75% (IQ3) | 5.9% | 5.3% |
| Interquartile Range (IQR) | 1.5% | 2.4% |
| Standard Deviation (Sample) | 2.5% | 2.7% |
| Standard Deviation (Population) | 2.4% | 2.6% |
Similar Demographics by Unemployment Among Ages 35 to 44 years
Demographics Similar to Central Americans by Unemployment Among Ages 35 to 44 years
In terms of unemployment among ages 35 to 44 years, the demographic groups most similar to Central Americans are Kiowa (5.1%, a difference of 0.050%), Guamanian/Chamorro (5.1%, a difference of 0.21%), Honduran (5.1%, a difference of 0.22%), Nigerian (5.1%, a difference of 0.28%), and Somali (5.1%, a difference of 0.41%).
| Demographics | Rating | Rank | Unemployment Among Ages 35 to 44 years |
| Immigrants | Cambodia | 1.5 /100 | #229 | Tragic 5.0% |
| Liberians | 1.3 /100 | #230 | Tragic 5.1% |
| Japanese | 1.2 /100 | #231 | Tragic 5.1% |
| Iroquois | 1.2 /100 | #232 | Tragic 5.1% |
| Immigrants | Nigeria | 1.2 /100 | #233 | Tragic 5.1% |
| Portuguese | 1.1 /100 | #234 | Tragic 5.1% |
| Guamanians/Chamorros | 0.9 /100 | #235 | Tragic 5.1% |
| Central Americans | 0.8 /100 | #236 | Tragic 5.1% |
| Kiowa | 0.8 /100 | #237 | Tragic 5.1% |
| Hondurans | 0.7 /100 | #238 | Tragic 5.1% |
| Nigerians | 0.7 /100 | #239 | Tragic 5.1% |
| Somalis | 0.7 /100 | #240 | Tragic 5.1% |
| Immigrants | Honduras | 0.6 /100 | #241 | Tragic 5.1% |
| Delaware | 0.5 /100 | #242 | Tragic 5.1% |
| Salvadorans | 0.4 /100 | #243 | Tragic 5.1% |
Demographics Similar to Immigrants from Singapore by Unemployment Among Ages 35 to 44 years
In terms of unemployment among ages 35 to 44 years, the demographic groups most similar to Immigrants from Singapore are Sudanese (4.1%, a difference of 0.070%), Venezuelan (4.1%, a difference of 0.17%), Bolivian (4.1%, a difference of 0.21%), Czech (4.1%, a difference of 0.31%), and Tongan (4.2%, a difference of 0.39%).
| Demographics | Rating | Rank | Unemployment Among Ages 35 to 44 years |
| Norwegians | 100.0 /100 | #3 | Exceptional 4.0% |
| Immigrants | Taiwan | 100.0 /100 | #4 | Exceptional 4.0% |
| Filipinos | 100.0 /100 | #5 | Exceptional 4.0% |
| Immigrants | Venezuela | 100.0 /100 | #6 | Exceptional 4.0% |
| Immigrants | Cuba | 99.9 /100 | #7 | Exceptional 4.1% |
| Immigrants | South Central Asia | 99.9 /100 | #8 | Exceptional 4.1% |
| Danes | 99.9 /100 | #9 | Exceptional 4.1% |
| Immigrants | Singapore | 99.9 /100 | #10 | Exceptional 4.1% |
| Sudanese | 99.9 /100 | #11 | Exceptional 4.1% |
| Venezuelans | 99.9 /100 | #12 | Exceptional 4.1% |
| Bolivians | 99.9 /100 | #13 | Exceptional 4.1% |
| Czechs | 99.9 /100 | #14 | Exceptional 4.1% |
| Tongans | 99.8 /100 | #15 | Exceptional 4.2% |
| Cubans | 99.8 /100 | #16 | Exceptional 4.2% |
| Swedes | 99.8 /100 | #17 | Exceptional 4.2% |