Central American vs Immigrants from England Nursery School
COMPARE
Central American
Immigrants from England
Nursery School
Nursery School Comparison
Central Americans
Immigrants from England
96.6%
NURSERY SCHOOL
0.0/ 100
METRIC RATING
333rd/ 347
METRIC RANK
98.3%
NURSERY SCHOOL
99.3/ 100
METRIC RATING
76th/ 347
METRIC RANK
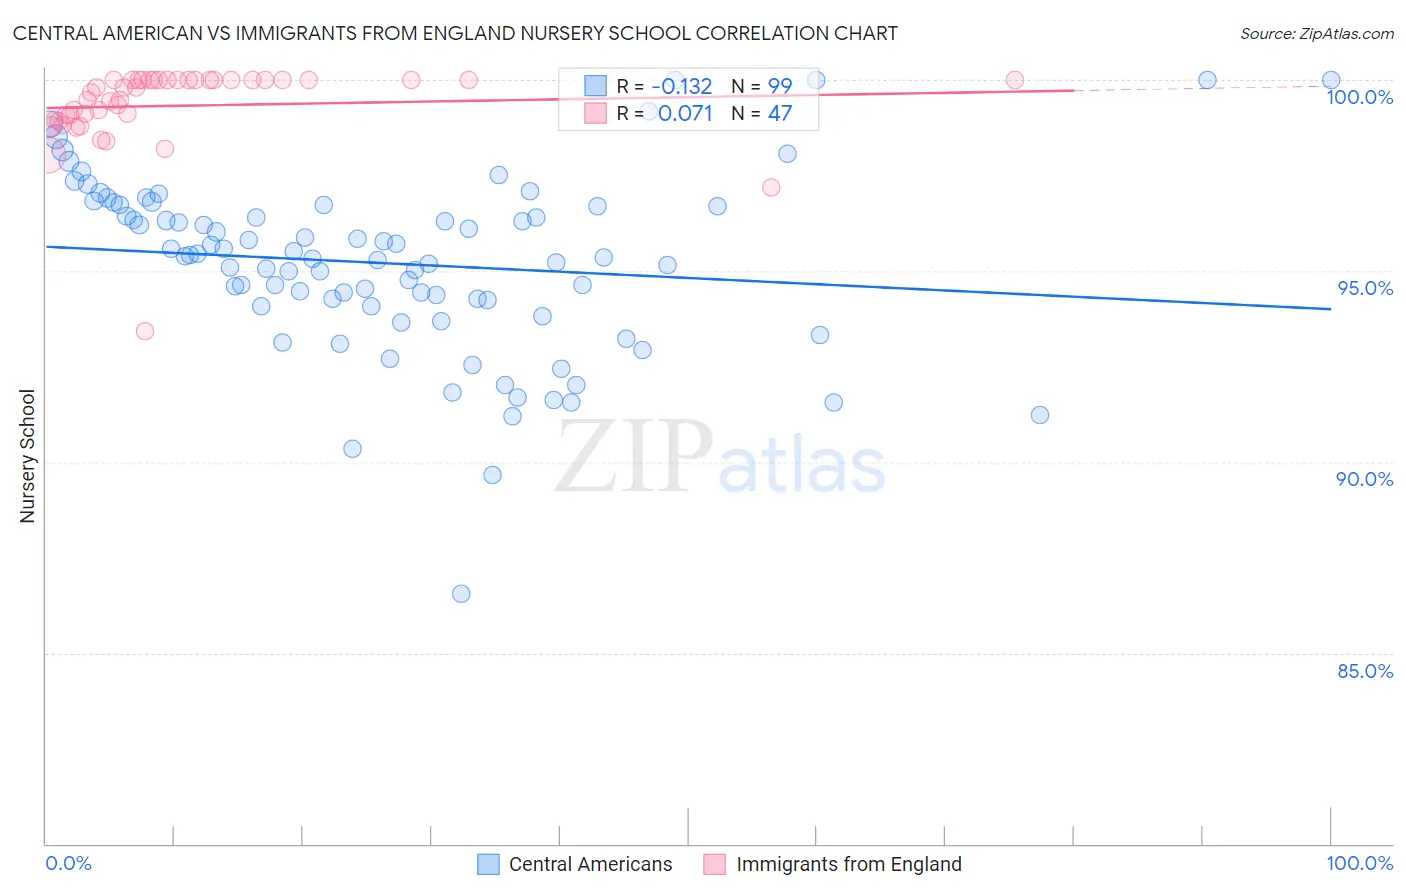
Central American vs Immigrants from England Nursery School Correlation Chart
The statistical analysis conducted on geographies consisting of 504,619,275 people shows a poor negative correlation between the proportion of Central Americans and percentage of population with at least nursery school education in the United States with a correlation coefficient (R) of -0.132 and weighted average of 96.6%. Similarly, the statistical analysis conducted on geographies consisting of 391,898,018 people shows a slight positive correlation between the proportion of Immigrants from England and percentage of population with at least nursery school education in the United States with a correlation coefficient (R) of 0.071 and weighted average of 98.3%, a difference of 1.8%.
Nursery School Correlation Summary
| Measurement | Central American | Immigrants from England |
| Minimum | 86.5% | 93.4% |
| Maximum | 100.0% | 100.0% |
| Range | 13.5% | 6.6% |
| Mean | 95.2% | 99.3% |
| Median | 95.4% | 99.8% |
| Interquartile 25% (IQ1) | 94.1% | 98.9% |
| Interquartile 75% (IQ3) | 96.7% | 100.0% |
| Interquartile Range (IQR) | 2.6% | 1.1% |
| Standard Deviation (Sample) | 2.3% | 1.1% |
| Standard Deviation (Population) | 2.3% | 1.1% |
Similar Demographics by Nursery School
Demographics Similar to Central Americans by Nursery School
In terms of nursery school, the demographic groups most similar to Central Americans are Immigrants from Dominican Republic (96.6%, a difference of 0.010%), Yakama (96.6%, a difference of 0.020%), Immigrants from Armenia (96.7%, a difference of 0.030%), Bangladeshi (96.6%, a difference of 0.040%), and Immigrants from Vietnam (96.7%, a difference of 0.060%).
| Demographics | Rating | Rank | Nursery School |
| Indonesians | 0.0 /100 | #326 | Tragic 96.8% |
| Mexicans | 0.0 /100 | #327 | Tragic 96.8% |
| Immigrants | Latin America | 0.0 /100 | #328 | Tragic 96.7% |
| Immigrants | Vietnam | 0.0 /100 | #329 | Tragic 96.7% |
| Japanese | 0.0 /100 | #330 | Tragic 96.7% |
| Immigrants | Armenia | 0.0 /100 | #331 | Tragic 96.7% |
| Yakama | 0.0 /100 | #332 | Tragic 96.6% |
| Central Americans | 0.0 /100 | #333 | Tragic 96.6% |
| Immigrants | Dominican Republic | 0.0 /100 | #334 | Tragic 96.6% |
| Bangladeshis | 0.0 /100 | #335 | Tragic 96.6% |
| Guatemalans | 0.0 /100 | #336 | Tragic 96.6% |
| Immigrants | Cambodia | 0.0 /100 | #337 | Tragic 96.5% |
| Immigrants | Fiji | 0.0 /100 | #338 | Tragic 96.5% |
| Immigrants | Guatemala | 0.0 /100 | #339 | Tragic 96.4% |
| Immigrants | Central America | 0.0 /100 | #340 | Tragic 96.4% |
Demographics Similar to Immigrants from England by Nursery School
In terms of nursery school, the demographic groups most similar to Immigrants from England are Cherokee (98.3%, a difference of 0.0%), Immigrants from Lithuania (98.3%, a difference of 0.0%), Delaware (98.3%, a difference of 0.0%), Immigrants from Belgium (98.3%, a difference of 0.0%), and Cajun (98.4%, a difference of 0.010%).
| Demographics | Rating | Rank | Nursery School |
| Immigrants | Austria | 99.6 /100 | #69 | Exceptional 98.4% |
| Cheyenne | 99.6 /100 | #70 | Exceptional 98.4% |
| Serbians | 99.6 /100 | #71 | Exceptional 98.4% |
| Chickasaw | 99.6 /100 | #72 | Exceptional 98.4% |
| Cajuns | 99.4 /100 | #73 | Exceptional 98.4% |
| Immigrants | Netherlands | 99.4 /100 | #74 | Exceptional 98.4% |
| Cherokee | 99.3 /100 | #75 | Exceptional 98.3% |
| Immigrants | England | 99.3 /100 | #76 | Exceptional 98.3% |
| Immigrants | Lithuania | 99.3 /100 | #77 | Exceptional 98.3% |
| Delaware | 99.3 /100 | #78 | Exceptional 98.3% |
| Immigrants | Belgium | 99.3 /100 | #79 | Exceptional 98.3% |
| Shoshone | 99.3 /100 | #80 | Exceptional 98.3% |
| Icelanders | 99.2 /100 | #81 | Exceptional 98.3% |
| Potawatomi | 99.2 /100 | #82 | Exceptional 98.3% |
| Osage | 99.1 /100 | #83 | Exceptional 98.3% |