Tongan vs Okinawan Unemployment Among Ages 65 to 74 years
COMPARE
Tongan
Okinawan
Unemployment Among Ages 65 to 74 years
Unemployment Among Ages 65 to 74 years Comparison
Tongans
Okinawans
4.7%
UNEMPLOYMENT AMONG AGES 65 TO 74 YEARS
100.0/ 100
METRIC RATING
12th/ 347
METRIC RANK
5.2%
UNEMPLOYMENT AMONG AGES 65 TO 74 YEARS
99.0/ 100
METRIC RATING
75th/ 347
METRIC RANK
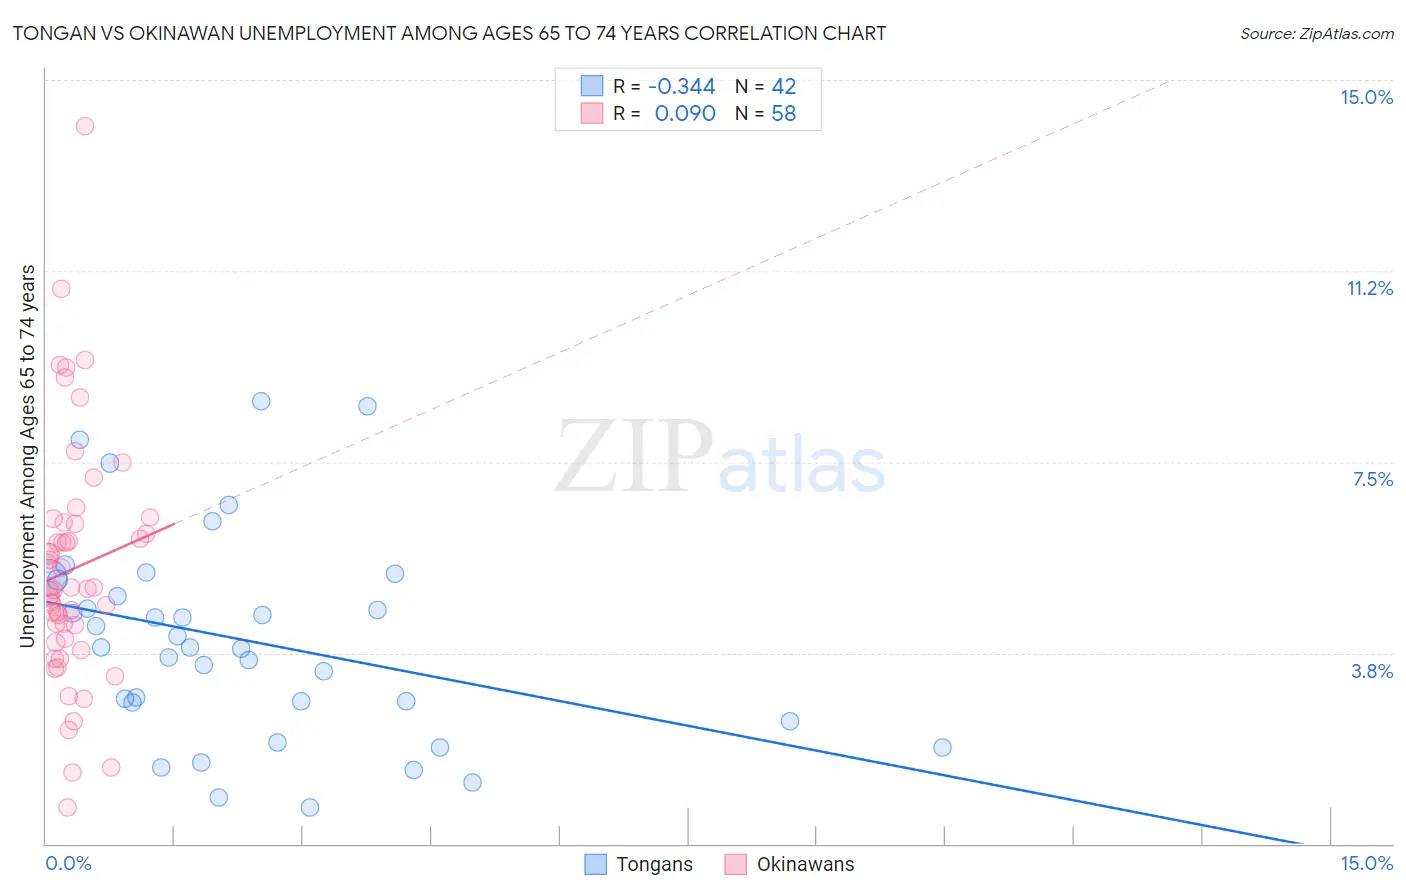
Tongan vs Okinawan Unemployment Among Ages 65 to 74 years Correlation Chart
The statistical analysis conducted on geographies consisting of 96,791,109 people shows a mild negative correlation between the proportion of Tongans and unemployment rate among population between the ages 65 and 74 in the United States with a correlation coefficient (R) of -0.344 and weighted average of 4.7%. Similarly, the statistical analysis conducted on geographies consisting of 71,850,554 people shows a slight positive correlation between the proportion of Okinawans and unemployment rate among population between the ages 65 and 74 in the United States with a correlation coefficient (R) of 0.090 and weighted average of 5.2%, a difference of 8.8%.
Unemployment Among Ages 65 to 74 years Correlation Summary
| Measurement | Tongan | Okinawan |
| Minimum | 0.70% | 0.70% |
| Maximum | 8.7% | 14.1% |
| Range | 8.0% | 13.4% |
| Mean | 4.0% | 5.4% |
| Median | 3.9% | 5.0% |
| Interquartile 25% (IQ1) | 2.8% | 4.0% |
| Interquartile 75% (IQ3) | 5.2% | 6.3% |
| Interquartile Range (IQR) | 2.4% | 2.3% |
| Standard Deviation (Sample) | 2.0% | 2.4% |
| Standard Deviation (Population) | 2.0% | 2.3% |
Similar Demographics by Unemployment Among Ages 65 to 74 years
Demographics Similar to Tongans by Unemployment Among Ages 65 to 74 years
In terms of unemployment among ages 65 to 74 years, the demographic groups most similar to Tongans are Immigrants from Congo (4.7%, a difference of 0.16%), Lumbee (4.8%, a difference of 0.18%), Cuban (4.8%, a difference of 0.47%), Osage (4.7%, a difference of 0.57%), and Chickasaw (4.7%, a difference of 0.68%).
| Demographics | Rating | Rank | Unemployment Among Ages 65 to 74 years |
| Sudanese | 100.0 /100 | #5 | Exceptional 4.6% |
| Immigrants | Cuba | 100.0 /100 | #6 | Exceptional 4.6% |
| Indonesians | 100.0 /100 | #7 | Exceptional 4.7% |
| Comanche | 100.0 /100 | #8 | Exceptional 4.7% |
| Chickasaw | 100.0 /100 | #9 | Exceptional 4.7% |
| Osage | 100.0 /100 | #10 | Exceptional 4.7% |
| Immigrants | Congo | 100.0 /100 | #11 | Exceptional 4.7% |
| Tongans | 100.0 /100 | #12 | Exceptional 4.7% |
| Lumbee | 100.0 /100 | #13 | Exceptional 4.8% |
| Cubans | 100.0 /100 | #14 | Exceptional 4.8% |
| Immigrants | North Macedonia | 100.0 /100 | #15 | Exceptional 4.8% |
| Immigrants | Burma/Myanmar | 100.0 /100 | #16 | Exceptional 4.8% |
| Kenyans | 100.0 /100 | #17 | Exceptional 4.8% |
| Creek | 100.0 /100 | #18 | Exceptional 4.8% |
| Menominee | 100.0 /100 | #19 | Exceptional 4.8% |
Demographics Similar to Okinawans by Unemployment Among Ages 65 to 74 years
In terms of unemployment among ages 65 to 74 years, the demographic groups most similar to Okinawans are Estonian (5.2%, a difference of 0.0%), Filipino (5.2%, a difference of 0.010%), Afghan (5.2%, a difference of 0.010%), Immigrants from Sudan (5.2%, a difference of 0.010%), and Northern European (5.2%, a difference of 0.020%).
| Demographics | Rating | Rank | Unemployment Among Ages 65 to 74 years |
| Latvians | 99.2 /100 | #68 | Exceptional 5.1% |
| Scandinavians | 99.1 /100 | #69 | Exceptional 5.2% |
| Immigrants | Japan | 99.1 /100 | #70 | Exceptional 5.2% |
| Scotch-Irish | 99.0 /100 | #71 | Exceptional 5.2% |
| Immigrants | Oceania | 99.0 /100 | #72 | Exceptional 5.2% |
| Filipinos | 99.0 /100 | #73 | Exceptional 5.2% |
| Afghans | 99.0 /100 | #74 | Exceptional 5.2% |
| Okinawans | 99.0 /100 | #75 | Exceptional 5.2% |
| Estonians | 99.0 /100 | #76 | Exceptional 5.2% |
| Immigrants | Sudan | 98.9 /100 | #77 | Exceptional 5.2% |
| Northern Europeans | 98.9 /100 | #78 | Exceptional 5.2% |
| Slavs | 98.7 /100 | #79 | Exceptional 5.2% |
| Immigrants | South Africa | 98.6 /100 | #80 | Exceptional 5.2% |
| Immigrants | Scotland | 98.6 /100 | #81 | Exceptional 5.2% |
| Thais | 98.6 /100 | #82 | Exceptional 5.2% |