Alsatian vs Senegalese Unemployment Among Ages 16 to 19 years
COMPARE
Alsatian
Senegalese
Unemployment Among Ages 16 to 19 years
Unemployment Among Ages 16 to 19 years Comparison
Alsatians
Senegalese
20.5%
UNEMPLOYMENT AMONG AGES 16 TO 19 YEARS
0.0/ 100
METRIC RATING
297th/ 347
METRIC RANK
21.0%
UNEMPLOYMENT AMONG AGES 16 TO 19 YEARS
0.0/ 100
METRIC RATING
303rd/ 347
METRIC RANK
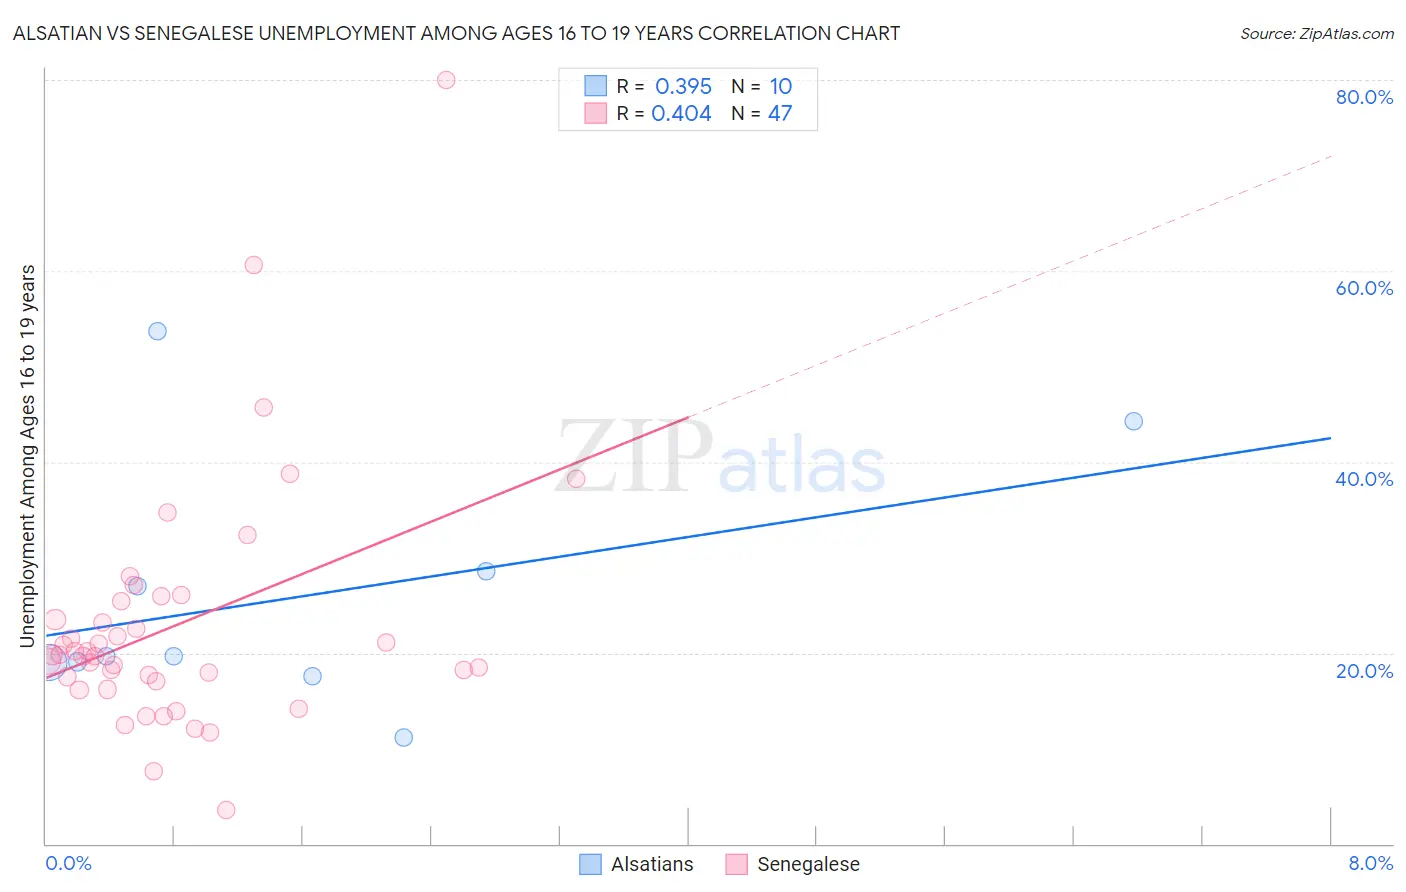
Alsatian vs Senegalese Unemployment Among Ages 16 to 19 years Correlation Chart
The statistical analysis conducted on geographies consisting of 80,609,155 people shows a mild positive correlation between the proportion of Alsatians and unemployment rate among population between the ages 16 and 19 in the United States with a correlation coefficient (R) of 0.395 and weighted average of 20.5%. Similarly, the statistical analysis conducted on geographies consisting of 77,377,459 people shows a moderate positive correlation between the proportion of Senegalese and unemployment rate among population between the ages 16 and 19 in the United States with a correlation coefficient (R) of 0.404 and weighted average of 21.0%, a difference of 2.3%.
Unemployment Among Ages 16 to 19 years Correlation Summary
| Measurement | Alsatian | Senegalese |
| Minimum | 11.1% | 3.6% |
| Maximum | 53.7% | 80.0% |
| Range | 42.6% | 76.4% |
| Mean | 26.0% | 22.8% |
| Median | 19.7% | 19.8% |
| Interquartile 25% (IQ1) | 19.0% | 17.0% |
| Interquartile 75% (IQ3) | 28.6% | 25.4% |
| Interquartile Range (IQR) | 9.6% | 8.3% |
| Standard Deviation (Sample) | 13.2% | 12.9% |
| Standard Deviation (Population) | 12.6% | 12.8% |
Demographics Similar to Alsatians and Senegalese by Unemployment Among Ages 16 to 19 years
In terms of unemployment among ages 16 to 19 years, the demographic groups most similar to Alsatians are Armenian (20.5%, a difference of 0.030%), Haitian (20.5%, a difference of 0.060%), Immigrants from Uzbekistan (20.5%, a difference of 0.11%), Ecuadorian (20.5%, a difference of 0.19%), and Central American Indian (20.4%, a difference of 0.32%). Similarly, the demographic groups most similar to Senegalese are Immigrants from Caribbean (20.9%, a difference of 0.38%), Immigrants from Ecuador (20.9%, a difference of 0.49%), Aleut (21.2%, a difference of 0.86%), Immigrants from Senegal (21.2%, a difference of 1.0%), and U.S. Virgin Islander (21.3%, a difference of 1.4%).
| Demographics | Rating | Rank | Unemployment Among Ages 16 to 19 years |
| Immigrants | Sierra Leone | 0.0 /100 | #290 | Tragic 20.0% |
| Immigrants | Yemen | 0.0 /100 | #291 | Tragic 20.0% |
| Comanche | 0.0 /100 | #292 | Tragic 20.2% |
| Immigrants | Bahamas | 0.0 /100 | #293 | Tragic 20.4% |
| Immigrants | Haiti | 0.0 /100 | #294 | Tragic 20.4% |
| Central American Indians | 0.0 /100 | #295 | Tragic 20.4% |
| Armenians | 0.0 /100 | #296 | Tragic 20.5% |
| Alsatians | 0.0 /100 | #297 | Tragic 20.5% |
| Haitians | 0.0 /100 | #298 | Tragic 20.5% |
| Immigrants | Uzbekistan | 0.0 /100 | #299 | Tragic 20.5% |
| Ecuadorians | 0.0 /100 | #300 | Tragic 20.5% |
| Immigrants | Ecuador | 0.0 /100 | #301 | Tragic 20.9% |
| Immigrants | Caribbean | 0.0 /100 | #302 | Tragic 20.9% |
| Senegalese | 0.0 /100 | #303 | Tragic 21.0% |
| Aleuts | 0.0 /100 | #304 | Tragic 21.2% |
| Immigrants | Senegal | 0.0 /100 | #305 | Tragic 21.2% |
| U.S. Virgin Islanders | 0.0 /100 | #306 | Tragic 21.3% |
| Blacks/African Americans | 0.0 /100 | #307 | Tragic 21.4% |
| Immigrants | Bangladesh | 0.0 /100 | #308 | Tragic 21.5% |
| Natives/Alaskans | 0.0 /100 | #309 | Tragic 21.5% |
| Vietnamese | 0.0 /100 | #310 | Tragic 21.5% |