Cambodian vs Immigrants from El Salvador Unemployment Among Women with Children Ages 6 to 17 years
COMPARE
Cambodian
Immigrants from El Salvador
Unemployment Among Women with Children Ages 6 to 17 years
Unemployment Among Women with Children Ages 6 to 17 years Comparison
Cambodians
Immigrants from El Salvador
7.5%
UNEMPLOYMENT AMONG WOMEN WITH CHILDREN AGES 6 TO 17 YEARS
100.0/ 100
METRIC RATING
17th/ 347
METRIC RANK
9.3%
UNEMPLOYMENT AMONG WOMEN WITH CHILDREN AGES 6 TO 17 YEARS
5.3/ 100
METRIC RATING
224th/ 347
METRIC RANK
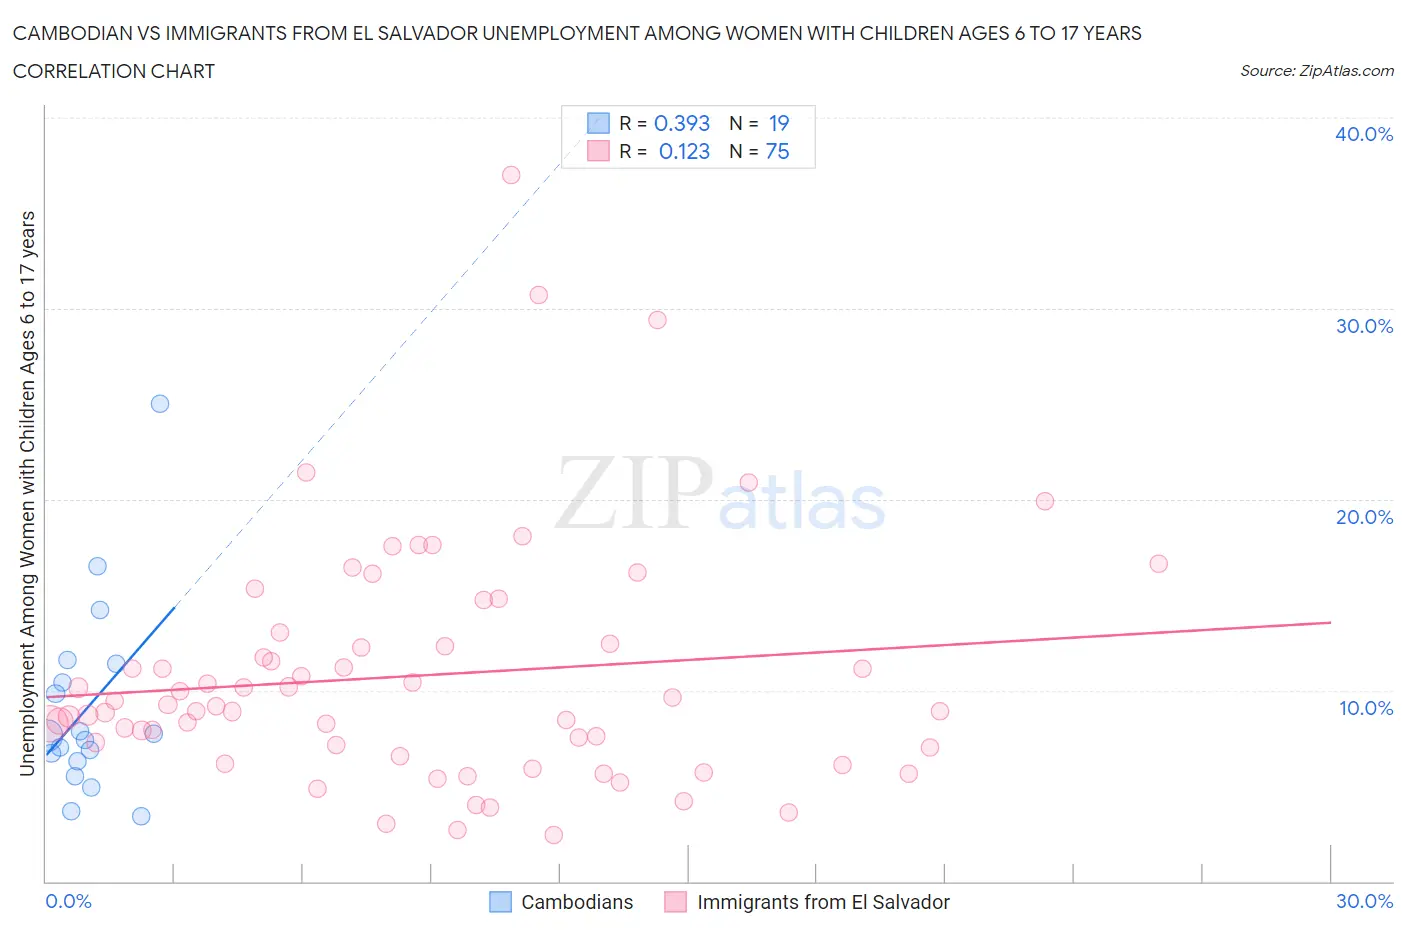
Cambodian vs Immigrants from El Salvador Unemployment Among Women with Children Ages 6 to 17 years Correlation Chart
The statistical analysis conducted on geographies consisting of 90,530,053 people shows a mild positive correlation between the proportion of Cambodians and unemployment rate among women with children between the ages 6 and 17 in the United States with a correlation coefficient (R) of 0.393 and weighted average of 7.5%. Similarly, the statistical analysis conducted on geographies consisting of 271,257,789 people shows a poor positive correlation between the proportion of Immigrants from El Salvador and unemployment rate among women with children between the ages 6 and 17 in the United States with a correlation coefficient (R) of 0.123 and weighted average of 9.3%, a difference of 22.9%.
Unemployment Among Women with Children Ages 6 to 17 years Correlation Summary
| Measurement | Cambodian | Immigrants from El Salvador |
| Minimum | 3.4% | 2.4% |
| Maximum | 25.0% | 37.0% |
| Range | 21.6% | 34.6% |
| Mean | 9.2% | 10.8% |
| Median | 7.6% | 9.2% |
| Interquartile 25% (IQ1) | 6.3% | 7.0% |
| Interquartile 75% (IQ3) | 11.4% | 12.4% |
| Interquartile Range (IQR) | 5.1% | 5.4% |
| Standard Deviation (Sample) | 5.1% | 6.3% |
| Standard Deviation (Population) | 5.0% | 6.3% |
Similar Demographics by Unemployment Among Women with Children Ages 6 to 17 years
Demographics Similar to Cambodians by Unemployment Among Women with Children Ages 6 to 17 years
In terms of unemployment among women with children ages 6 to 17 years, the demographic groups most similar to Cambodians are Immigrants from Burma/Myanmar (7.5%, a difference of 0.18%), Puget Sound Salish (7.5%, a difference of 0.54%), Afghan (7.6%, a difference of 0.65%), Filipino (7.6%, a difference of 0.68%), and Sudanese (7.4%, a difference of 1.6%).
| Demographics | Rating | Rank | Unemployment Among Women with Children Ages 6 to 17 years |
| Immigrants | Fiji | 100.0 /100 | #10 | Exceptional 7.3% |
| Immigrants | Taiwan | 100.0 /100 | #11 | Exceptional 7.3% |
| Bangladeshis | 100.0 /100 | #12 | Exceptional 7.4% |
| Indonesians | 100.0 /100 | #13 | Exceptional 7.4% |
| Sudanese | 100.0 /100 | #14 | Exceptional 7.4% |
| Puget Sound Salish | 100.0 /100 | #15 | Exceptional 7.5% |
| Immigrants | Burma/Myanmar | 100.0 /100 | #16 | Exceptional 7.5% |
| Cambodians | 100.0 /100 | #17 | Exceptional 7.5% |
| Afghans | 100.0 /100 | #18 | Exceptional 7.6% |
| Filipinos | 100.0 /100 | #19 | Exceptional 7.6% |
| Immigrants | Singapore | 100.0 /100 | #20 | Exceptional 7.7% |
| Immigrants | India | 100.0 /100 | #21 | Exceptional 7.7% |
| Immigrants | China | 100.0 /100 | #22 | Exceptional 7.7% |
| Immigrants | Indonesia | 100.0 /100 | #23 | Exceptional 7.7% |
| Nepalese | 100.0 /100 | #24 | Exceptional 7.7% |
Demographics Similar to Immigrants from El Salvador by Unemployment Among Women with Children Ages 6 to 17 years
In terms of unemployment among women with children ages 6 to 17 years, the demographic groups most similar to Immigrants from El Salvador are Chinese (9.3%, a difference of 0.010%), Immigrants from Eritrea (9.2%, a difference of 0.10%), Immigrants from Southern Europe (9.2%, a difference of 0.11%), Crow (9.2%, a difference of 0.12%), and Immigrants from the Azores (9.3%, a difference of 0.15%).
| Demographics | Rating | Rank | Unemployment Among Women with Children Ages 6 to 17 years |
| Germans | 7.2 /100 | #217 | Tragic 9.2% |
| Syrians | 6.9 /100 | #218 | Tragic 9.2% |
| Immigrants | Scotland | 6.6 /100 | #219 | Tragic 9.2% |
| Belgians | 6.4 /100 | #220 | Tragic 9.2% |
| Crow | 5.8 /100 | #221 | Tragic 9.2% |
| Immigrants | Southern Europe | 5.8 /100 | #222 | Tragic 9.2% |
| Immigrants | Eritrea | 5.8 /100 | #223 | Tragic 9.2% |
| Immigrants | El Salvador | 5.3 /100 | #224 | Tragic 9.3% |
| Chinese | 5.2 /100 | #225 | Tragic 9.3% |
| Immigrants | Azores | 4.6 /100 | #226 | Tragic 9.3% |
| Panamanians | 4.5 /100 | #227 | Tragic 9.3% |
| Estonians | 4.4 /100 | #228 | Tragic 9.3% |
| Lumbee | 4.3 /100 | #229 | Tragic 9.3% |
| Welsh | 4.0 /100 | #230 | Tragic 9.3% |
| Macedonians | 3.9 /100 | #231 | Tragic 9.3% |