Immigrants from Belarus vs Yup'ik Female Unemployment
COMPARE
Immigrants from Belarus
Yup'ik
Female Unemployment
Female Unemployment Comparison
Immigrants from Belarus
Yup'ik
5.3%
FEMALE UNEMPLOYMENT
39.4/ 100
METRIC RATING
186th/ 347
METRIC RANK
10.9%
FEMALE UNEMPLOYMENT
0.0/ 100
METRIC RATING
346th/ 347
METRIC RANK
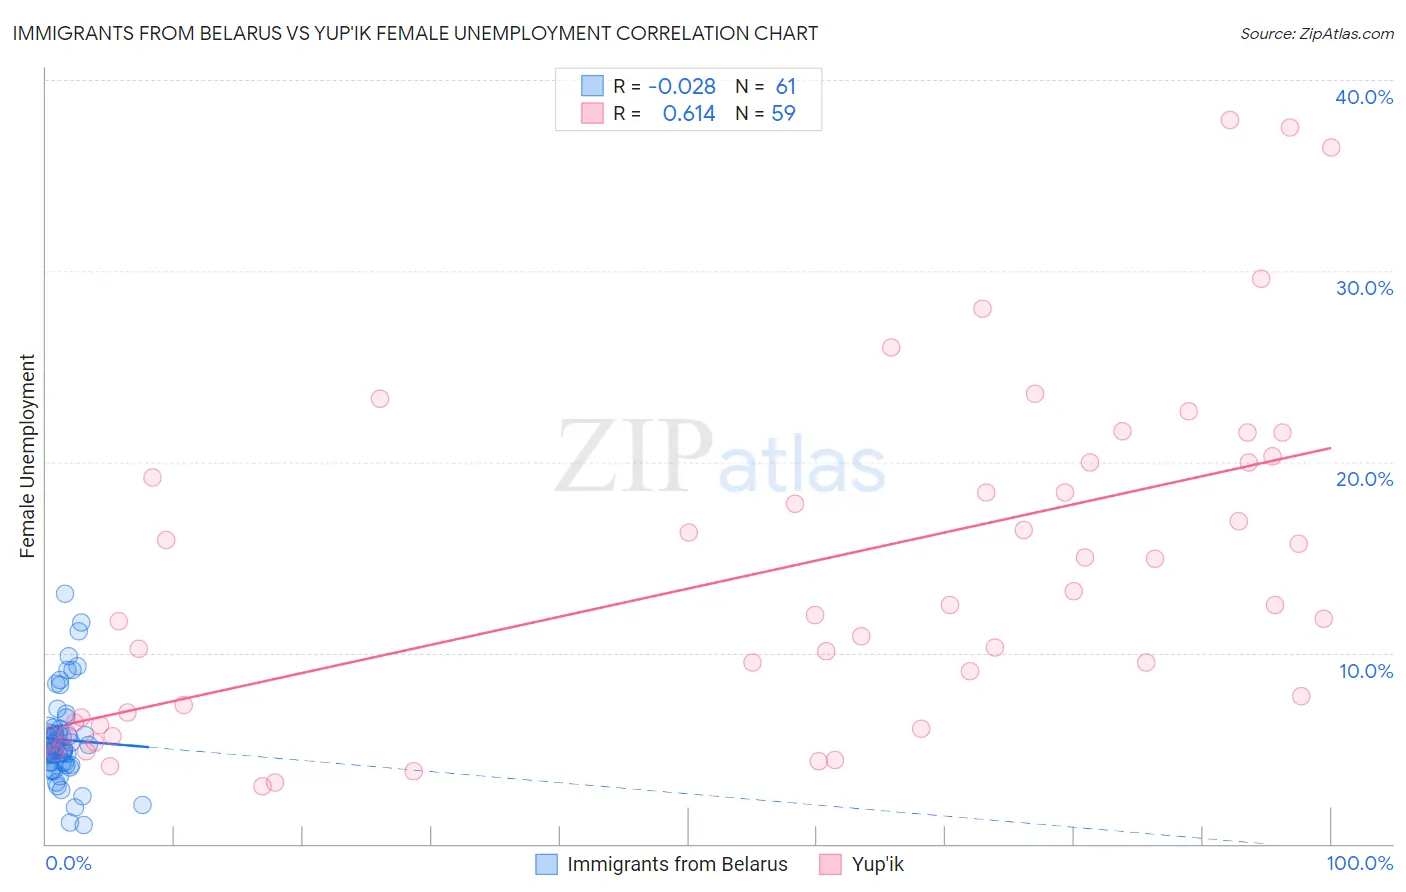
Immigrants from Belarus vs Yup'ik Female Unemployment Correlation Chart
The statistical analysis conducted on geographies consisting of 150,026,552 people shows no correlation between the proportion of Immigrants from Belarus and unemploymnet rate among females in the United States with a correlation coefficient (R) of -0.028 and weighted average of 5.3%. Similarly, the statistical analysis conducted on geographies consisting of 39,915,126 people shows a significant positive correlation between the proportion of Yup'ik and unemploymnet rate among females in the United States with a correlation coefficient (R) of 0.614 and weighted average of 10.9%, a difference of 105.5%.
Female Unemployment Correlation Summary
| Measurement | Immigrants from Belarus | Yup'ik |
| Minimum | 1.0% | 3.0% |
| Maximum | 13.1% | 37.9% |
| Range | 12.1% | 34.9% |
| Mean | 5.4% | 14.0% |
| Median | 5.0% | 12.0% |
| Interquartile 25% (IQ1) | 4.2% | 6.2% |
| Interquartile 75% (IQ3) | 6.0% | 20.0% |
| Interquartile Range (IQR) | 1.9% | 13.8% |
| Standard Deviation (Sample) | 2.4% | 8.8% |
| Standard Deviation (Population) | 2.4% | 8.8% |
Similar Demographics by Female Unemployment
Demographics Similar to Immigrants from Belarus by Female Unemployment
In terms of female unemployment, the demographic groups most similar to Immigrants from Belarus are Malaysian (5.3%, a difference of 0.040%), Immigrants from Ukraine (5.3%, a difference of 0.050%), Immigrants from Indonesia (5.3%, a difference of 0.080%), Taiwanese (5.3%, a difference of 0.20%), and Nonimmigrants (5.3%, a difference of 0.20%).
| Demographics | Rating | Rank | Female Unemployment |
| Laotians | 45.1 /100 | #179 | Average 5.3% |
| Immigrants | Congo | 43.1 /100 | #180 | Average 5.3% |
| Taiwanese | 42.7 /100 | #181 | Average 5.3% |
| Immigrants | Nonimmigrants | 42.6 /100 | #182 | Average 5.3% |
| Immigrants | Indonesia | 40.7 /100 | #183 | Average 5.3% |
| Immigrants | Ukraine | 40.1 /100 | #184 | Average 5.3% |
| Malaysians | 40.1 /100 | #185 | Average 5.3% |
| Immigrants | Belarus | 39.4 /100 | #186 | Fair 5.3% |
| Immigrants | Albania | 35.4 /100 | #187 | Fair 5.3% |
| Afghans | 33.9 /100 | #188 | Fair 5.3% |
| Costa Ricans | 33.8 /100 | #189 | Fair 5.3% |
| Ugandans | 31.2 /100 | #190 | Fair 5.3% |
| Cherokee | 30.8 /100 | #191 | Fair 5.3% |
| Portuguese | 28.6 /100 | #192 | Fair 5.3% |
| Arabs | 27.7 /100 | #193 | Fair 5.3% |
Demographics Similar to Yup'ik by Female Unemployment
In terms of female unemployment, the demographic groups most similar to Yup'ik are Crow (12.1%, a difference of 11.5%), Yuman (9.6%, a difference of 13.4%), Pima (9.3%, a difference of 16.5%), Arapaho (8.8%, a difference of 23.7%), and Puerto Rican (8.3%, a difference of 30.4%).
| Demographics | Rating | Rank | Female Unemployment |
| Menominee | 0.0 /100 | #333 | Tragic 7.0% |
| Immigrants | Armenia | 0.0 /100 | #334 | Tragic 7.1% |
| Dominicans | 0.0 /100 | #335 | Tragic 7.2% |
| Immigrants | Dominican Republic | 0.0 /100 | #336 | Tragic 7.2% |
| Navajo | 0.0 /100 | #337 | Tragic 7.3% |
| Tohono O'odham | 0.0 /100 | #338 | Tragic 7.7% |
| Immigrants | Yemen | 0.0 /100 | #339 | Tragic 7.8% |
| Hopi | 0.0 /100 | #340 | Tragic 8.1% |
| Inupiat | 0.0 /100 | #341 | Tragic 8.2% |
| Puerto Ricans | 0.0 /100 | #342 | Tragic 8.3% |
| Arapaho | 0.0 /100 | #343 | Tragic 8.8% |
| Pima | 0.0 /100 | #344 | Tragic 9.3% |
| Yuman | 0.0 /100 | #345 | Tragic 9.6% |
| Yup'ik | 0.0 /100 | #346 | Tragic 10.9% |
| Crow | 0.0 /100 | #347 | Tragic 12.1% |