Cajun vs Romanian Unemployment Among Women with Children Ages 6 to 17 years
COMPARE
Cajun
Romanian
Unemployment Among Women with Children Ages 6 to 17 years
Unemployment Among Women with Children Ages 6 to 17 years Comparison
Cajuns
Romanians
10.8%
UNEMPLOYMENT AMONG WOMEN WITH CHILDREN AGES 6 TO 17 YEARS
0.0/ 100
METRIC RATING
325th/ 347
METRIC RANK
8.6%
UNEMPLOYMENT AMONG WOMEN WITH CHILDREN AGES 6 TO 17 YEARS
97.1/ 100
METRIC RATING
112th/ 347
METRIC RANK
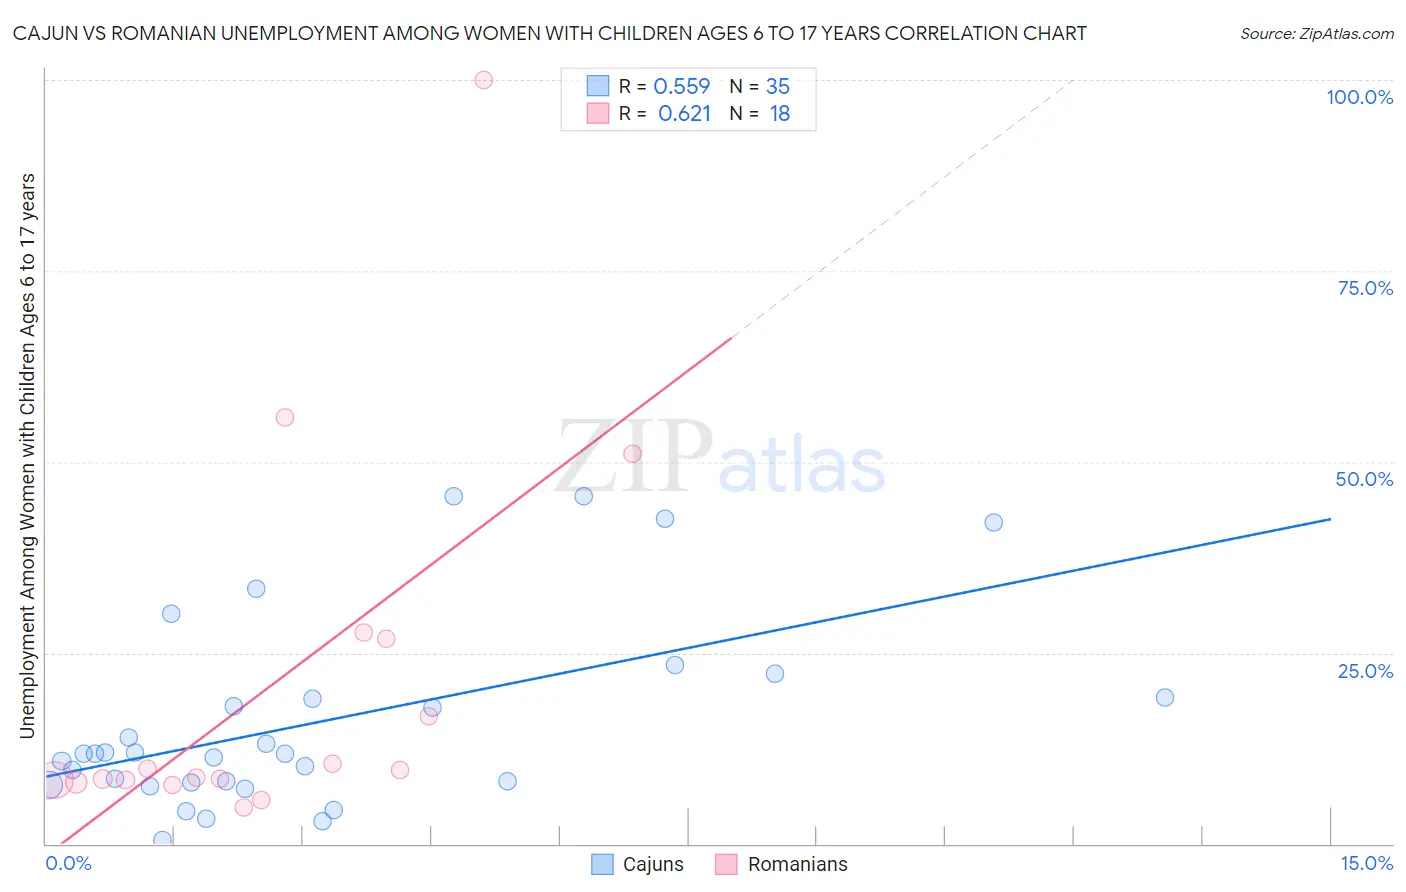
Cajun vs Romanian Unemployment Among Women with Children Ages 6 to 17 years Correlation Chart
The statistical analysis conducted on geographies consisting of 120,661,780 people shows a substantial positive correlation between the proportion of Cajuns and unemployment rate among women with children between the ages 6 and 17 in the United States with a correlation coefficient (R) of 0.559 and weighted average of 10.8%. Similarly, the statistical analysis conducted on geographies consisting of 267,762,836 people shows a significant positive correlation between the proportion of Romanians and unemployment rate among women with children between the ages 6 and 17 in the United States with a correlation coefficient (R) of 0.621 and weighted average of 8.6%, a difference of 25.9%.
Unemployment Among Women with Children Ages 6 to 17 years Correlation Summary
| Measurement | Cajun | Romanian |
| Minimum | 0.48% | 4.8% |
| Maximum | 45.5% | 100.0% |
| Range | 45.0% | 95.2% |
| Mean | 15.9% | 20.9% |
| Median | 11.8% | 9.2% |
| Interquartile 25% (IQ1) | 8.0% | 8.4% |
| Interquartile 75% (IQ3) | 19.2% | 26.8% |
| Interquartile Range (IQR) | 11.2% | 18.5% |
| Standard Deviation (Sample) | 12.5% | 24.8% |
| Standard Deviation (Population) | 12.3% | 24.1% |
Similar Demographics by Unemployment Among Women with Children Ages 6 to 17 years
Demographics Similar to Cajuns by Unemployment Among Women with Children Ages 6 to 17 years
In terms of unemployment among women with children ages 6 to 17 years, the demographic groups most similar to Cajuns are Liberian (10.8%, a difference of 0.070%), Cape Verdean (10.9%, a difference of 0.13%), Immigrants from Dominican Republic (10.8%, a difference of 0.18%), Dominican (10.8%, a difference of 0.24%), and Ottawa (10.9%, a difference of 0.27%).
| Demographics | Rating | Rank | Unemployment Among Women with Children Ages 6 to 17 years |
| Delaware | 0.0 /100 | #318 | Tragic 10.5% |
| Immigrants | Uganda | 0.0 /100 | #319 | Tragic 10.7% |
| Apache | 0.0 /100 | #320 | Tragic 10.7% |
| Tohono O'odham | 0.0 /100 | #321 | Tragic 10.7% |
| Cree | 0.0 /100 | #322 | Tragic 10.8% |
| Dominicans | 0.0 /100 | #323 | Tragic 10.8% |
| Immigrants | Dominican Republic | 0.0 /100 | #324 | Tragic 10.8% |
| Cajuns | 0.0 /100 | #325 | Tragic 10.8% |
| Liberians | 0.0 /100 | #326 | Tragic 10.8% |
| Cape Verdeans | 0.0 /100 | #327 | Tragic 10.9% |
| Ottawa | 0.0 /100 | #328 | Tragic 10.9% |
| Pennsylvania Germans | 0.0 /100 | #329 | Tragic 11.0% |
| Chippewa | 0.0 /100 | #330 | Tragic 11.1% |
| Blacks/African Americans | 0.0 /100 | #331 | Tragic 11.4% |
| Tsimshian | 0.0 /100 | #332 | Tragic 11.4% |
Demographics Similar to Romanians by Unemployment Among Women with Children Ages 6 to 17 years
In terms of unemployment among women with children ages 6 to 17 years, the demographic groups most similar to Romanians are Immigrants from Ukraine (8.6%, a difference of 0.12%), Latvian (8.6%, a difference of 0.13%), Immigrants from Romania (8.6%, a difference of 0.14%), Eastern European (8.6%, a difference of 0.15%), and Immigrants from Russia (8.6%, a difference of 0.16%).
| Demographics | Rating | Rank | Unemployment Among Women with Children Ages 6 to 17 years |
| Immigrants | Norway | 97.8 /100 | #105 | Exceptional 8.6% |
| Immigrants | Serbia | 97.7 /100 | #106 | Exceptional 8.6% |
| Chickasaw | 97.6 /100 | #107 | Exceptional 8.6% |
| Swedes | 97.6 /100 | #108 | Exceptional 8.6% |
| Immigrants | Romania | 97.5 /100 | #109 | Exceptional 8.6% |
| Latvians | 97.4 /100 | #110 | Exceptional 8.6% |
| Immigrants | Ukraine | 97.4 /100 | #111 | Exceptional 8.6% |
| Romanians | 97.1 /100 | #112 | Exceptional 8.6% |
| Eastern Europeans | 96.8 /100 | #113 | Exceptional 8.6% |
| Immigrants | Russia | 96.7 /100 | #114 | Exceptional 8.6% |
| Argentineans | 96.5 /100 | #115 | Exceptional 8.6% |
| Zimbabweans | 96.3 /100 | #116 | Exceptional 8.6% |
| Albanians | 96.3 /100 | #117 | Exceptional 8.6% |
| Pueblo | 96.2 /100 | #118 | Exceptional 8.6% |
| Immigrants | Grenada | 96.2 /100 | #119 | Exceptional 8.6% |