Cajun vs Bhutanese Unemployment Among Youth under 25 years
COMPARE
Cajun
Bhutanese
Unemployment Among Youth under 25 years
Unemployment Among Youth under 25 years Comparison
Cajuns
Bhutanese
13.2%
UNEMPLOYMENT AMONG YOUTH UNDER 25 YEARS
0.0/ 100
METRIC RATING
279th/ 347
METRIC RANK
11.2%
UNEMPLOYMENT AMONG YOUTH UNDER 25 YEARS
97.4/ 100
METRIC RATING
71st/ 347
METRIC RANK
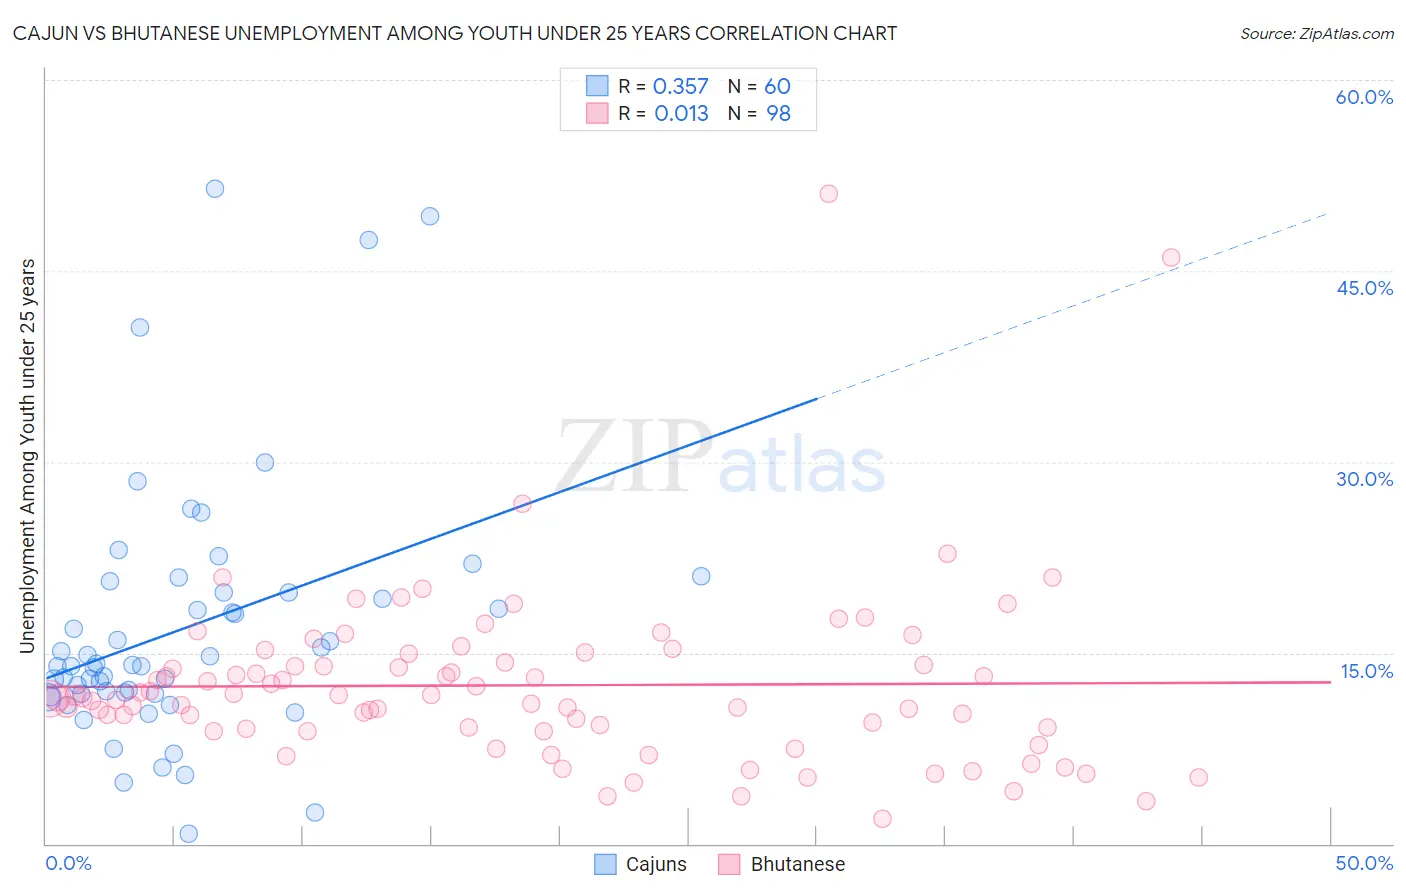
Cajun vs Bhutanese Unemployment Among Youth under 25 years Correlation Chart
The statistical analysis conducted on geographies consisting of 148,147,814 people shows a mild positive correlation between the proportion of Cajuns and unemployment rate among youth under the age of 25 in the United States with a correlation coefficient (R) of 0.357 and weighted average of 13.2%. Similarly, the statistical analysis conducted on geographies consisting of 448,134,198 people shows no correlation between the proportion of Bhutanese and unemployment rate among youth under the age of 25 in the United States with a correlation coefficient (R) of 0.013 and weighted average of 11.2%, a difference of 18.6%.
Unemployment Among Youth under 25 years Correlation Summary
| Measurement | Cajun | Bhutanese |
| Minimum | 0.80% | 2.0% |
| Maximum | 51.5% | 51.1% |
| Range | 50.7% | 49.1% |
| Mean | 16.9% | 12.4% |
| Median | 14.0% | 11.5% |
| Interquartile 25% (IQ1) | 11.8% | 9.1% |
| Interquartile 75% (IQ3) | 19.8% | 14.2% |
| Interquartile Range (IQR) | 8.0% | 5.2% |
| Standard Deviation (Sample) | 10.1% | 7.0% |
| Standard Deviation (Population) | 10.0% | 7.0% |
Similar Demographics by Unemployment Among Youth under 25 years
Demographics Similar to Cajuns by Unemployment Among Youth under 25 years
In terms of unemployment among youth under 25 years, the demographic groups most similar to Cajuns are Ute (13.3%, a difference of 0.25%), Armenian (13.3%, a difference of 0.28%), Sierra Leonean (13.3%, a difference of 0.29%), Immigrants from Cameroon (13.3%, a difference of 0.32%), and Lumbee (13.3%, a difference of 0.33%).
| Demographics | Rating | Rank | Unemployment Among Youth under 25 years |
| Cape Verdeans | 0.0 /100 | #272 | Tragic 12.9% |
| Nigerians | 0.0 /100 | #273 | Tragic 13.0% |
| Immigrants | Nigeria | 0.0 /100 | #274 | Tragic 13.0% |
| Bermudans | 0.0 /100 | #275 | Tragic 13.0% |
| Immigrants | Uzbekistan | 0.0 /100 | #276 | Tragic 13.1% |
| Bahamians | 0.0 /100 | #277 | Tragic 13.1% |
| Africans | 0.0 /100 | #278 | Tragic 13.2% |
| Cajuns | 0.0 /100 | #279 | Tragic 13.2% |
| Ute | 0.0 /100 | #280 | Tragic 13.3% |
| Armenians | 0.0 /100 | #281 | Tragic 13.3% |
| Sierra Leoneans | 0.0 /100 | #282 | Tragic 13.3% |
| Immigrants | Cameroon | 0.0 /100 | #283 | Tragic 13.3% |
| Lumbee | 0.0 /100 | #284 | Tragic 13.3% |
| Ghanaians | 0.0 /100 | #285 | Tragic 13.3% |
| Blackfeet | 0.0 /100 | #286 | Tragic 13.3% |
Demographics Similar to Bhutanese by Unemployment Among Youth under 25 years
In terms of unemployment among youth under 25 years, the demographic groups most similar to Bhutanese are Immigrants from Moldova (11.2%, a difference of 0.040%), Slavic (11.2%, a difference of 0.040%), Immigrants from Australia (11.2%, a difference of 0.040%), Immigrants from Kenya (11.2%, a difference of 0.090%), and Creek (11.2%, a difference of 0.090%).
| Demographics | Rating | Rank | Unemployment Among Youth under 25 years |
| Jordanians | 97.9 /100 | #64 | Exceptional 11.1% |
| Immigrants | Singapore | 97.8 /100 | #65 | Exceptional 11.2% |
| Macedonians | 97.7 /100 | #66 | Exceptional 11.2% |
| Chickasaw | 97.7 /100 | #67 | Exceptional 11.2% |
| Immigrants | Kenya | 97.6 /100 | #68 | Exceptional 11.2% |
| Immigrants | Moldova | 97.5 /100 | #69 | Exceptional 11.2% |
| Slavs | 97.5 /100 | #70 | Exceptional 11.2% |
| Bhutanese | 97.4 /100 | #71 | Exceptional 11.2% |
| Immigrants | Australia | 97.3 /100 | #72 | Exceptional 11.2% |
| Creek | 97.2 /100 | #73 | Exceptional 11.2% |
| New Zealanders | 97.2 /100 | #74 | Exceptional 11.2% |
| French | 97.1 /100 | #75 | Exceptional 11.2% |
| German Russians | 97.0 /100 | #76 | Exceptional 11.2% |
| Whites/Caucasians | 96.9 /100 | #77 | Exceptional 11.2% |
| Immigrants | Nicaragua | 96.7 /100 | #78 | Exceptional 11.2% |