Burmese vs Indian (Asian) Unemployment Among Youth under 25 years
COMPARE
Burmese
Indian (Asian)
Unemployment Among Youth under 25 years
Unemployment Among Youth under 25 years Comparison
Burmese
Indians (Asian)
11.3%
UNEMPLOYMENT AMONG YOUTH UNDER 25 YEARS
89.8/ 100
METRIC RATING
116th/ 347
METRIC RANK
11.5%
UNEMPLOYMENT AMONG YOUTH UNDER 25 YEARS
65.1/ 100
METRIC RATING
157th/ 347
METRIC RANK
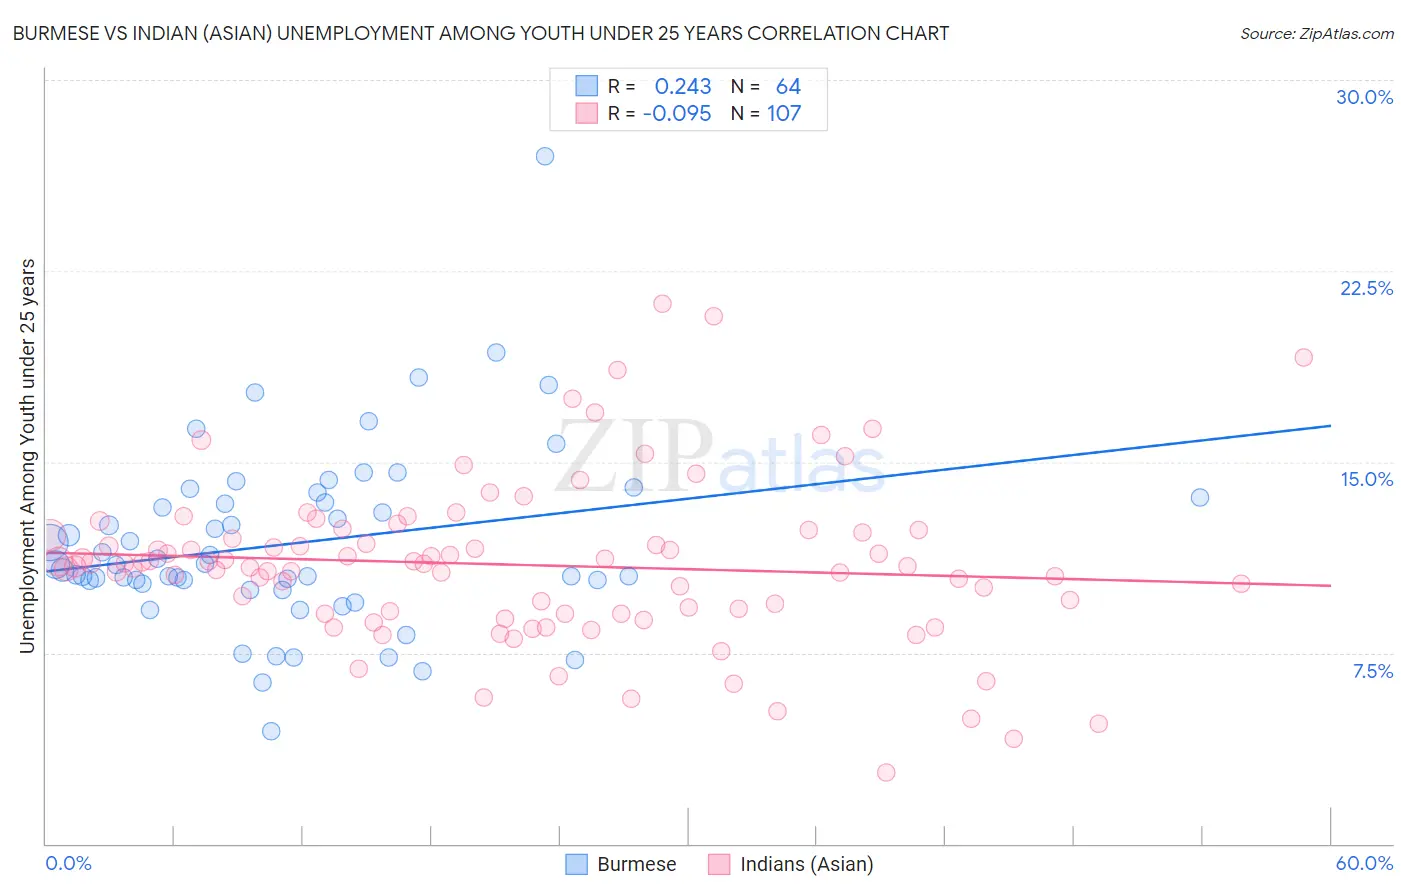
Burmese vs Indian (Asian) Unemployment Among Youth under 25 years Correlation Chart
The statistical analysis conducted on geographies consisting of 457,894,407 people shows a weak positive correlation between the proportion of Burmese and unemployment rate among youth under the age of 25 in the United States with a correlation coefficient (R) of 0.243 and weighted average of 11.3%. Similarly, the statistical analysis conducted on geographies consisting of 485,546,701 people shows a slight negative correlation between the proportion of Indians (Asian) and unemployment rate among youth under the age of 25 in the United States with a correlation coefficient (R) of -0.095 and weighted average of 11.5%, a difference of 1.6%.
Unemployment Among Youth under 25 years Correlation Summary
| Measurement | Burmese | Indian (Asian) |
| Minimum | 4.4% | 2.8% |
| Maximum | 27.0% | 21.2% |
| Range | 22.6% | 18.4% |
| Mean | 11.8% | 11.0% |
| Median | 11.0% | 11.0% |
| Interquartile 25% (IQ1) | 10.3% | 9.1% |
| Interquartile 75% (IQ3) | 13.5% | 12.2% |
| Interquartile Range (IQR) | 3.2% | 3.2% |
| Standard Deviation (Sample) | 3.6% | 3.2% |
| Standard Deviation (Population) | 3.5% | 3.2% |
Similar Demographics by Unemployment Among Youth under 25 years
Demographics Similar to Burmese by Unemployment Among Youth under 25 years
In terms of unemployment among youth under 25 years, the demographic groups most similar to Burmese are Immigrants from Vietnam (11.3%, a difference of 0.010%), Sri Lankan (11.3%, a difference of 0.010%), Afghan (11.3%, a difference of 0.010%), Immigrants from Ethiopia (11.3%, a difference of 0.020%), and Fijian (11.3%, a difference of 0.050%).
| Demographics | Rating | Rank | Unemployment Among Youth under 25 years |
| Iranians | 92.0 /100 | #109 | Exceptional 11.3% |
| Immigrants | Norway | 91.5 /100 | #110 | Exceptional 11.3% |
| Immigrants | France | 90.3 /100 | #111 | Exceptional 11.3% |
| Immigrants | Austria | 90.3 /100 | #112 | Exceptional 11.3% |
| Fijians | 90.2 /100 | #113 | Exceptional 11.3% |
| Immigrants | Ethiopia | 89.9 /100 | #114 | Excellent 11.3% |
| Immigrants | Vietnam | 89.9 /100 | #115 | Excellent 11.3% |
| Burmese | 89.8 /100 | #116 | Excellent 11.3% |
| Sri Lankans | 89.8 /100 | #117 | Excellent 11.3% |
| Afghans | 89.7 /100 | #118 | Excellent 11.3% |
| Immigrants | Scotland | 89.2 /100 | #119 | Excellent 11.4% |
| Malaysians | 89.0 /100 | #120 | Excellent 11.4% |
| Slovaks | 88.9 /100 | #121 | Excellent 11.4% |
| Immigrants | Micronesia | 88.1 /100 | #122 | Excellent 11.4% |
| Basques | 87.8 /100 | #123 | Excellent 11.4% |
Demographics Similar to Indians (Asian) by Unemployment Among Youth under 25 years
In terms of unemployment among youth under 25 years, the demographic groups most similar to Indians (Asian) are Immigrants from Turkey (11.5%, a difference of 0.020%), Immigrants from Western Europe (11.5%, a difference of 0.020%), Immigrants from Germany (11.5%, a difference of 0.030%), Immigrants from Eastern Asia (11.5%, a difference of 0.030%), and Ukrainian (11.5%, a difference of 0.040%).
| Demographics | Rating | Rank | Unemployment Among Youth under 25 years |
| Immigrants | Switzerland | 71.6 /100 | #150 | Good 11.5% |
| Uruguayans | 70.4 /100 | #151 | Good 11.5% |
| Iraqis | 68.3 /100 | #152 | Good 11.5% |
| Immigrants | Czechoslovakia | 67.1 /100 | #153 | Good 11.5% |
| Immigrants | Asia | 66.7 /100 | #154 | Good 11.5% |
| Immigrants | Romania | 66.3 /100 | #155 | Good 11.5% |
| Immigrants | Germany | 65.9 /100 | #156 | Good 11.5% |
| Indians (Asian) | 65.1 /100 | #157 | Good 11.5% |
| Immigrants | Turkey | 64.8 /100 | #158 | Good 11.5% |
| Immigrants | Western Europe | 64.7 /100 | #159 | Good 11.5% |
| Immigrants | Eastern Asia | 64.5 /100 | #160 | Good 11.5% |
| Ukrainians | 64.3 /100 | #161 | Good 11.5% |
| Immigrants | Northern Africa | 62.7 /100 | #162 | Good 11.5% |
| Immigrants | Kazakhstan | 62.7 /100 | #163 | Good 11.5% |
| Immigrants | Laos | 62.4 /100 | #164 | Good 11.5% |