British West Indian vs Armenian Unemployment Among Ages 65 to 74 years
COMPARE
British West Indian
Armenian
Unemployment Among Ages 65 to 74 years
Unemployment Among Ages 65 to 74 years Comparison
British West Indians
Armenians
5.8%
UNEMPLOYMENT AMONG AGES 65 TO 74 YEARS
0.0/ 100
METRIC RATING
307th/ 347
METRIC RANK
5.8%
UNEMPLOYMENT AMONG AGES 65 TO 74 YEARS
0.0/ 100
METRIC RATING
301st/ 347
METRIC RANK
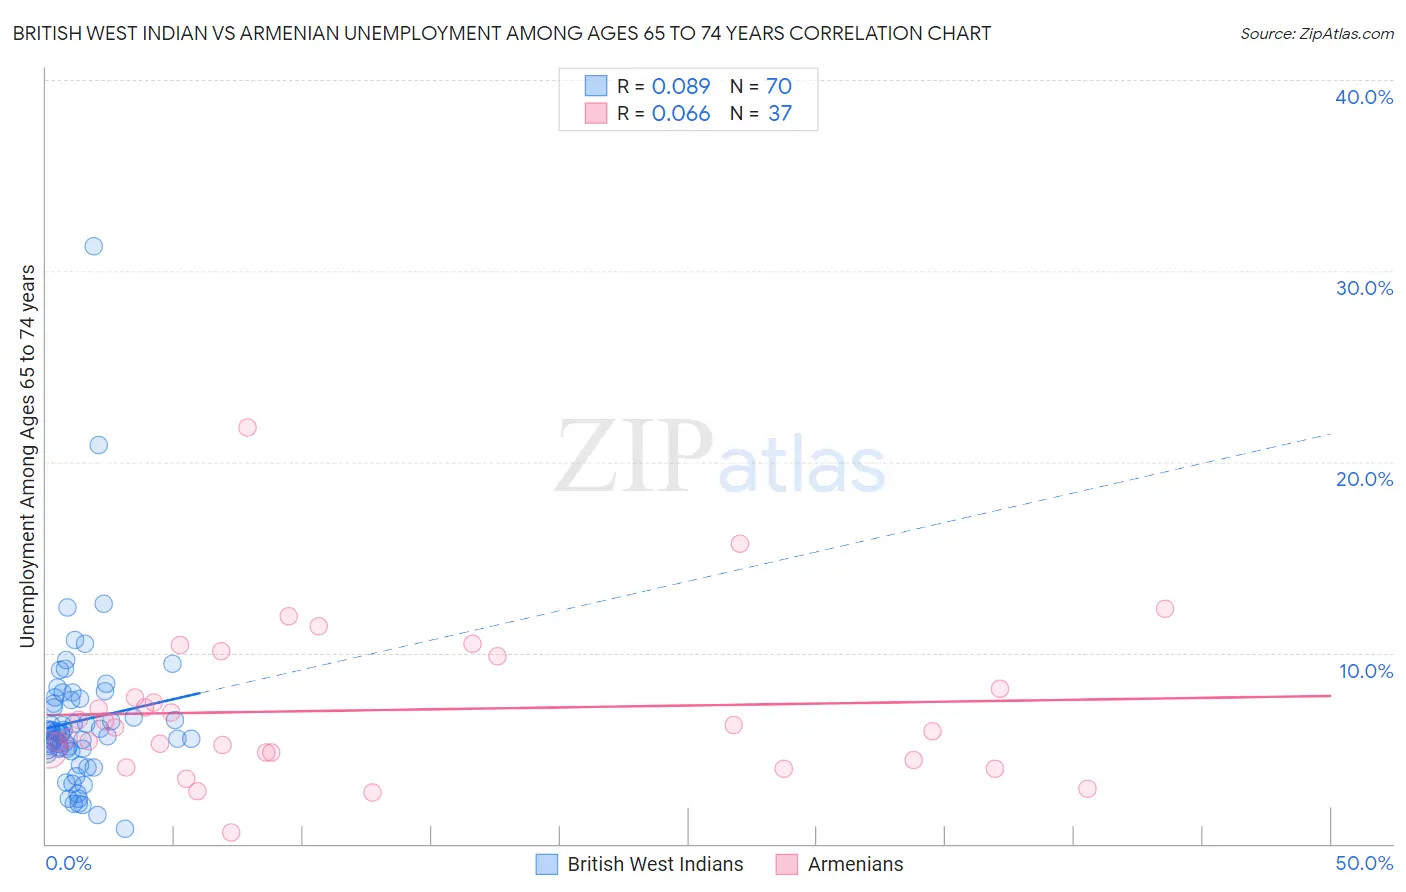
British West Indian vs Armenian Unemployment Among Ages 65 to 74 years Correlation Chart
The statistical analysis conducted on geographies consisting of 144,276,982 people shows a slight positive correlation between the proportion of British West Indians and unemployment rate among population between the ages 65 and 74 in the United States with a correlation coefficient (R) of 0.089 and weighted average of 5.8%. Similarly, the statistical analysis conducted on geographies consisting of 282,681,828 people shows a slight positive correlation between the proportion of Armenians and unemployment rate among population between the ages 65 and 74 in the United States with a correlation coefficient (R) of 0.066 and weighted average of 5.8%, a difference of 0.17%.
Unemployment Among Ages 65 to 74 years Correlation Summary
| Measurement | British West Indian | Armenian |
| Minimum | 0.80% | 0.60% |
| Maximum | 31.3% | 21.8% |
| Range | 30.5% | 21.2% |
| Mean | 6.4% | 7.0% |
| Median | 5.8% | 6.1% |
| Interquartile 25% (IQ1) | 5.0% | 4.6% |
| Interquartile 75% (IQ3) | 7.5% | 8.9% |
| Interquartile Range (IQR) | 2.6% | 4.4% |
| Standard Deviation (Sample) | 4.2% | 4.0% |
| Standard Deviation (Population) | 4.2% | 4.0% |
Demographics Similar to British West Indians and Armenians by Unemployment Among Ages 65 to 74 years
In terms of unemployment among ages 65 to 74 years, the demographic groups most similar to British West Indians are Cheyenne (5.8%, a difference of 0.0%), Mexican (5.8%, a difference of 0.010%), Arapaho (5.8%, a difference of 0.020%), Salvadoran (5.8%, a difference of 0.020%), and Liberian (5.8%, a difference of 0.050%). Similarly, the demographic groups most similar to Armenians are Ecuadorian (5.8%, a difference of 0.11%), Immigrants from Latin America (5.8%, a difference of 0.12%), Barbadian (5.8%, a difference of 0.12%), Liberian (5.8%, a difference of 0.12%), and Arapaho (5.8%, a difference of 0.15%).
| Demographics | Rating | Rank | Unemployment Among Ages 65 to 74 years |
| Immigrants | Morocco | 0.0 /100 | #294 | Tragic 5.8% |
| Blacks/African Americans | 0.0 /100 | #295 | Tragic 5.8% |
| Pennsylvania Germans | 0.0 /100 | #296 | Tragic 5.8% |
| Houma | 0.0 /100 | #297 | Tragic 5.8% |
| Immigrants | Latin America | 0.0 /100 | #298 | Tragic 5.8% |
| Barbadians | 0.0 /100 | #299 | Tragic 5.8% |
| Ecuadorians | 0.0 /100 | #300 | Tragic 5.8% |
| Armenians | 0.0 /100 | #301 | Tragic 5.8% |
| Liberians | 0.0 /100 | #302 | Tragic 5.8% |
| Arapaho | 0.0 /100 | #303 | Tragic 5.8% |
| Salvadorans | 0.0 /100 | #304 | Tragic 5.8% |
| Mexicans | 0.0 /100 | #305 | Tragic 5.8% |
| Cheyenne | 0.0 /100 | #306 | Tragic 5.8% |
| British West Indians | 0.0 /100 | #307 | Tragic 5.8% |
| Guatemalans | 0.0 /100 | #308 | Tragic 5.8% |
| Immigrants | Ecuador | 0.0 /100 | #309 | Tragic 5.8% |
| Immigrants | Bangladesh | 0.0 /100 | #310 | Tragic 5.9% |
| Venezuelans | 0.0 /100 | #311 | Tragic 5.9% |
| Hispanics or Latinos | 0.0 /100 | #312 | Tragic 5.9% |
| Vietnamese | 0.0 /100 | #313 | Tragic 5.9% |
| Immigrants | Venezuela | 0.0 /100 | #314 | Tragic 5.9% |