Immigrants from Micronesia vs Korean Unemployment Among Ages 16 to 19 years
COMPARE
Immigrants from Micronesia
Korean
Unemployment Among Ages 16 to 19 years
Unemployment Among Ages 16 to 19 years Comparison
Immigrants from Micronesia
Koreans
17.6%
UNEMPLOYMENT AMONG AGES 16 TO 19 YEARS
42.4/ 100
METRIC RATING
187th/ 347
METRIC RANK
17.5%
UNEMPLOYMENT AMONG AGES 16 TO 19 YEARS
61.0/ 100
METRIC RATING
159th/ 347
METRIC RANK
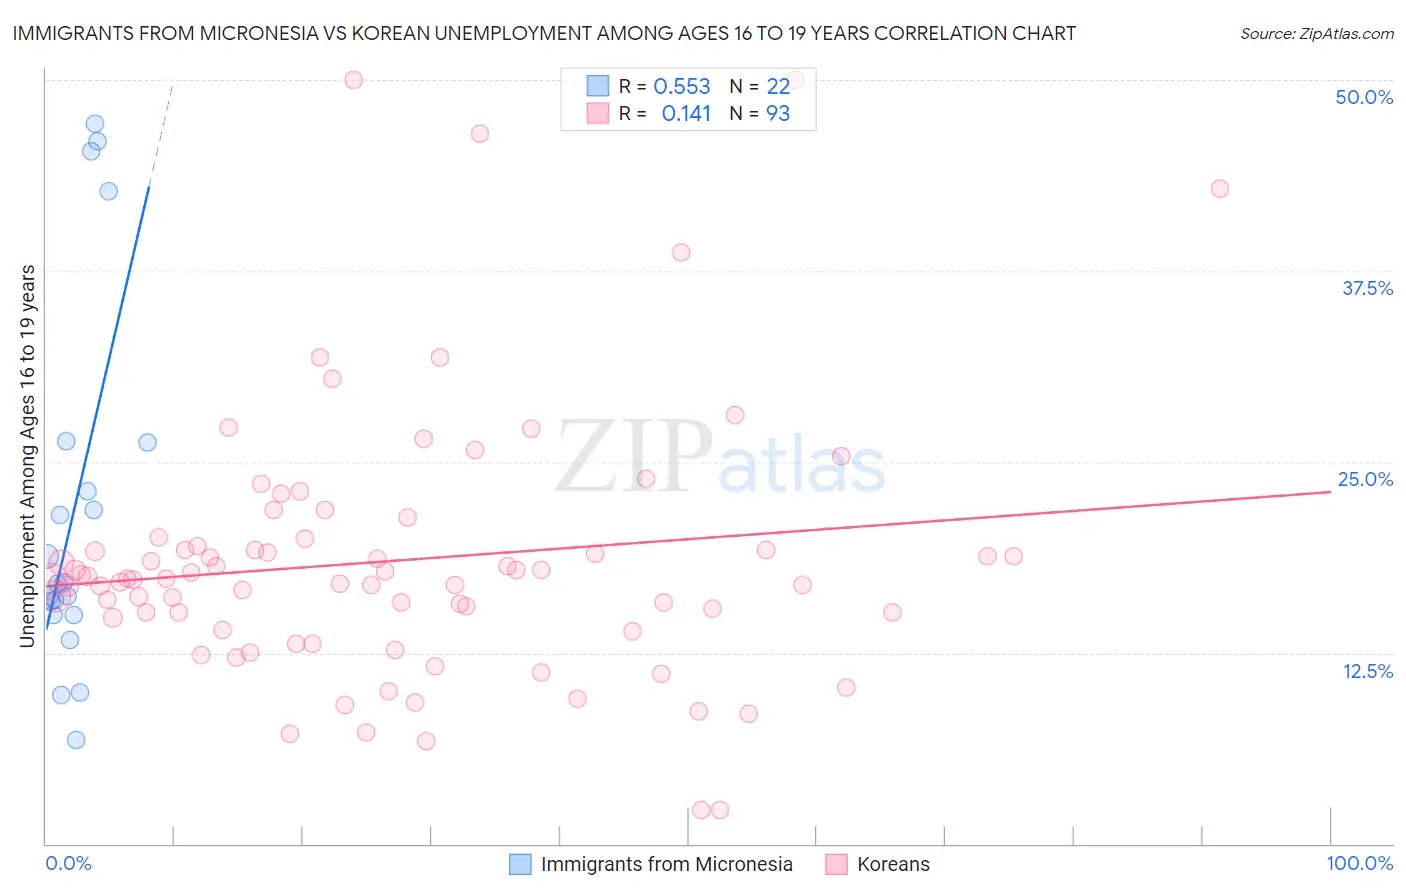
Immigrants from Micronesia vs Korean Unemployment Among Ages 16 to 19 years Correlation Chart
The statistical analysis conducted on geographies consisting of 60,570,430 people shows a substantial positive correlation between the proportion of Immigrants from Micronesia and unemployment rate among population between the ages 16 and 19 in the United States with a correlation coefficient (R) of 0.553 and weighted average of 17.6%. Similarly, the statistical analysis conducted on geographies consisting of 473,448,884 people shows a poor positive correlation between the proportion of Koreans and unemployment rate among population between the ages 16 and 19 in the United States with a correlation coefficient (R) of 0.141 and weighted average of 17.5%, a difference of 0.90%.
Unemployment Among Ages 16 to 19 years Correlation Summary
| Measurement | Immigrants from Micronesia | Korean |
| Minimum | 6.8% | 2.2% |
| Maximum | 47.1% | 50.0% |
| Range | 40.3% | 47.8% |
| Mean | 22.1% | 18.5% |
| Median | 17.0% | 17.4% |
| Interquartile 25% (IQ1) | 15.0% | 14.4% |
| Interquartile 75% (IQ3) | 26.3% | 19.7% |
| Interquartile Range (IQR) | 11.3% | 5.3% |
| Standard Deviation (Sample) | 12.2% | 8.6% |
| Standard Deviation (Population) | 11.9% | 8.6% |
Similar Demographics by Unemployment Among Ages 16 to 19 years
Demographics Similar to Immigrants from Micronesia by Unemployment Among Ages 16 to 19 years
In terms of unemployment among ages 16 to 19 years, the demographic groups most similar to Immigrants from Micronesia are Immigrants from Nicaragua (17.6%, a difference of 0.010%), Immigrants from Europe (17.6%, a difference of 0.030%), Marshallese (17.6%, a difference of 0.030%), Japanese (17.6%, a difference of 0.040%), and Iroquois (17.6%, a difference of 0.050%).
| Demographics | Rating | Rank | Unemployment Among Ages 16 to 19 years |
| Spaniards | 47.1 /100 | #180 | Average 17.6% |
| Immigrants | Turkey | 45.6 /100 | #181 | Average 17.6% |
| Russians | 45.2 /100 | #182 | Average 17.6% |
| Immigrants | Uruguay | 44.6 /100 | #183 | Average 17.6% |
| Eastern Europeans | 44.3 /100 | #184 | Average 17.6% |
| Iroquois | 43.4 /100 | #185 | Average 17.6% |
| Japanese | 43.2 /100 | #186 | Average 17.6% |
| Immigrants | Micronesia | 42.4 /100 | #187 | Average 17.6% |
| Immigrants | Nicaragua | 42.2 /100 | #188 | Average 17.6% |
| Immigrants | Europe | 41.8 /100 | #189 | Average 17.6% |
| Marshallese | 41.7 /100 | #190 | Average 17.6% |
| Immigrants | Costa Rica | 41.3 /100 | #191 | Average 17.6% |
| Immigrants | Philippines | 40.7 /100 | #192 | Average 17.7% |
| Immigrants | Australia | 40.6 /100 | #193 | Average 17.7% |
| Peruvians | 38.8 /100 | #194 | Fair 17.7% |
Demographics Similar to Koreans by Unemployment Among Ages 16 to 19 years
In terms of unemployment among ages 16 to 19 years, the demographic groups most similar to Koreans are Ukrainian (17.5%, a difference of 0.020%), Immigrants from Denmark (17.5%, a difference of 0.040%), Immigrants from Norway (17.5%, a difference of 0.060%), Egyptian (17.5%, a difference of 0.060%), and Immigrants from China (17.5%, a difference of 0.16%).
| Demographics | Rating | Rank | Unemployment Among Ages 16 to 19 years |
| Immigrants | Northern Africa | 69.0 /100 | #152 | Good 17.4% |
| Immigrants | Afghanistan | 68.6 /100 | #153 | Good 17.4% |
| Afghans | 68.1 /100 | #154 | Good 17.4% |
| Portuguese | 67.3 /100 | #155 | Good 17.4% |
| Costa Ricans | 65.9 /100 | #156 | Good 17.4% |
| Uruguayans | 64.3 /100 | #157 | Good 17.5% |
| Immigrants | China | 64.1 /100 | #158 | Good 17.5% |
| Koreans | 61.0 /100 | #159 | Good 17.5% |
| Ukrainians | 60.5 /100 | #160 | Good 17.5% |
| Immigrants | Denmark | 60.3 /100 | #161 | Good 17.5% |
| Immigrants | Norway | 59.8 /100 | #162 | Average 17.5% |
| Egyptians | 59.7 /100 | #163 | Average 17.5% |
| Immigrants | Austria | 57.7 /100 | #164 | Average 17.5% |
| Cape Verdeans | 55.8 /100 | #165 | Average 17.5% |
| Immigrants | Italy | 55.2 /100 | #166 | Average 17.5% |