British West Indian vs Immigrants from South Central Asia Unemployment Among Ages 60 to 64 years
COMPARE
British West Indian
Immigrants from South Central Asia
Unemployment Among Ages 60 to 64 years
Unemployment Among Ages 60 to 64 years Comparison
British West Indians
Immigrants from South Central Asia
5.5%
UNEMPLOYMENT AMONG AGES 60 TO 64 YEARS
0.0/ 100
METRIC RATING
310th/ 347
METRIC RANK
4.7%
UNEMPLOYMENT AMONG AGES 60 TO 64 YEARS
93.0/ 100
METRIC RATING
126th/ 347
METRIC RANK
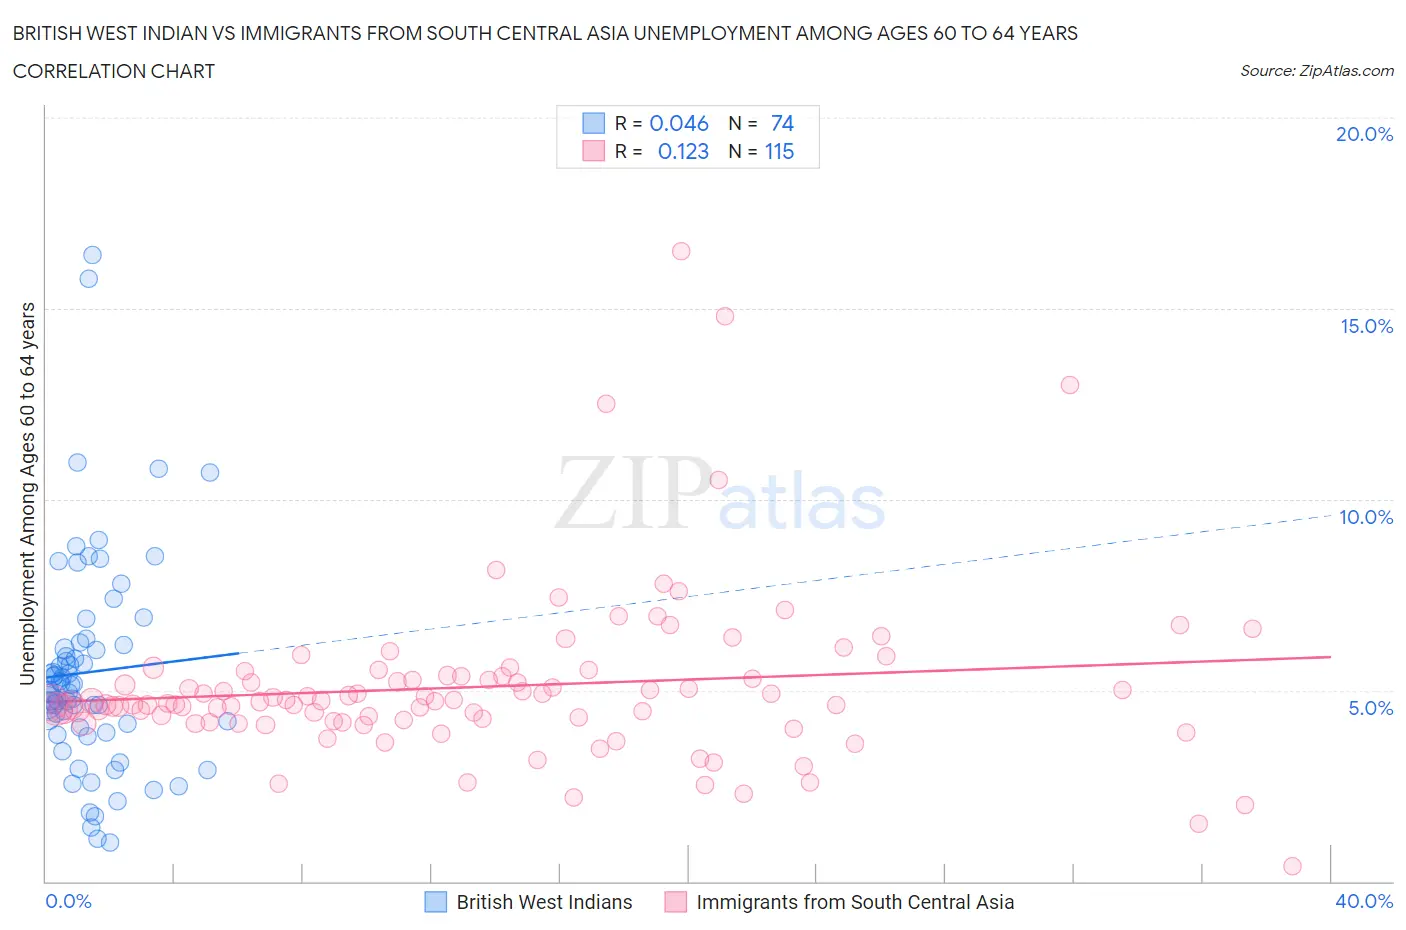
British West Indian vs Immigrants from South Central Asia Unemployment Among Ages 60 to 64 years Correlation Chart
The statistical analysis conducted on geographies consisting of 146,208,505 people shows no correlation between the proportion of British West Indians and unemployment rate among population between the ages 60 and 64 in the United States with a correlation coefficient (R) of 0.046 and weighted average of 5.5%. Similarly, the statistical analysis conducted on geographies consisting of 418,199,861 people shows a poor positive correlation between the proportion of Immigrants from South Central Asia and unemployment rate among population between the ages 60 and 64 in the United States with a correlation coefficient (R) of 0.123 and weighted average of 4.7%, a difference of 15.0%.
Unemployment Among Ages 60 to 64 years Correlation Summary
| Measurement | British West Indian | Immigrants from South Central Asia |
| Minimum | 1.0% | 0.40% |
| Maximum | 16.4% | 16.5% |
| Range | 15.4% | 16.1% |
| Mean | 5.5% | 5.1% |
| Median | 5.1% | 4.7% |
| Interquartile 25% (IQ1) | 4.0% | 4.2% |
| Interquartile 75% (IQ3) | 6.2% | 5.4% |
| Interquartile Range (IQR) | 2.2% | 1.2% |
| Standard Deviation (Sample) | 2.8% | 2.2% |
| Standard Deviation (Population) | 2.8% | 2.2% |
Similar Demographics by Unemployment Among Ages 60 to 64 years
Demographics Similar to British West Indians by Unemployment Among Ages 60 to 64 years
In terms of unemployment among ages 60 to 64 years, the demographic groups most similar to British West Indians are U.S. Virgin Islander (5.5%, a difference of 0.020%), Immigrants from West Indies (5.5%, a difference of 0.20%), Belizean (5.5%, a difference of 0.90%), Soviet Union (5.4%, a difference of 0.92%), and Spanish American Indian (5.4%, a difference of 0.93%).
| Demographics | Rating | Rank | Unemployment Among Ages 60 to 64 years |
| Bahamians | 0.0 /100 | #303 | Tragic 5.4% |
| Immigrants | Mexico | 0.0 /100 | #304 | Tragic 5.4% |
| Cypriots | 0.0 /100 | #305 | Tragic 5.4% |
| Immigrants | Dominica | 0.0 /100 | #306 | Tragic 5.4% |
| Immigrants | Guyana | 0.0 /100 | #307 | Tragic 5.4% |
| Spanish American Indians | 0.0 /100 | #308 | Tragic 5.4% |
| Soviet Union | 0.0 /100 | #309 | Tragic 5.4% |
| British West Indians | 0.0 /100 | #310 | Tragic 5.5% |
| U.S. Virgin Islanders | 0.0 /100 | #311 | Tragic 5.5% |
| Immigrants | West Indies | 0.0 /100 | #312 | Tragic 5.5% |
| Belizeans | 0.0 /100 | #313 | Tragic 5.5% |
| Guyanese | 0.0 /100 | #314 | Tragic 5.5% |
| Cree | 0.0 /100 | #315 | Tragic 5.6% |
| Cheyenne | 0.0 /100 | #316 | Tragic 5.6% |
| Shoshone | 0.0 /100 | #317 | Tragic 5.7% |
Demographics Similar to Immigrants from South Central Asia by Unemployment Among Ages 60 to 64 years
In terms of unemployment among ages 60 to 64 years, the demographic groups most similar to Immigrants from South Central Asia are Immigrants from Thailand (4.7%, a difference of 0.10%), Austrian (4.8%, a difference of 0.14%), Immigrants from Senegal (4.7%, a difference of 0.24%), Finnish (4.7%, a difference of 0.27%), and Choctaw (4.8%, a difference of 0.32%).
| Demographics | Rating | Rank | Unemployment Among Ages 60 to 64 years |
| Immigrants | Morocco | 95.7 /100 | #119 | Exceptional 4.7% |
| Macedonians | 95.7 /100 | #120 | Exceptional 4.7% |
| Albanians | 95.3 /100 | #121 | Exceptional 4.7% |
| Immigrants | Kazakhstan | 95.1 /100 | #122 | Exceptional 4.7% |
| Finns | 94.7 /100 | #123 | Exceptional 4.7% |
| Immigrants | Senegal | 94.5 /100 | #124 | Exceptional 4.7% |
| Immigrants | Thailand | 93.7 /100 | #125 | Exceptional 4.7% |
| Immigrants | South Central Asia | 93.0 /100 | #126 | Exceptional 4.7% |
| Austrians | 91.9 /100 | #127 | Exceptional 4.8% |
| Choctaw | 90.3 /100 | #128 | Exceptional 4.8% |
| Immigrants | Serbia | 90.2 /100 | #129 | Exceptional 4.8% |
| Immigrants | Syria | 90.1 /100 | #130 | Exceptional 4.8% |
| Immigrants | Lebanon | 89.6 /100 | #131 | Excellent 4.8% |
| Lithuanians | 89.6 /100 | #132 | Excellent 4.8% |
| Yaqui | 89.5 /100 | #133 | Excellent 4.8% |