British vs Honduran Unemployment Among Women with Children Under 18 years

COMPARE

British
Race
Ancestry
AfghanAfricanAlaska NativeAlaskan AthabascanAlbanianAleutAlsatianAmericanApacheArabArapahoArgentineanArmenianAssyrian/Chaldean/SyriacAustralianAustrianBahamianBangladeshiBarbadianBasqueBelgianBelizeanBermudanBhutaneseBlackfeetBolivianBrazilianBritishBritish West IndianBulgarianBurmeseCajunCambodianCanadianCape VerdeanCarpatho RusynCelticCentral AmericanCentral American IndianCherokeeCheyenneChickasawChileanChineseChippewaChoctawColombianColvilleComancheCosta RicanCreeCreekCroatianCrowCubanCypriotCzechCzechoslovakianDanishDelawareDominicanDutchDutch West IndianEastern EuropeanEcuadorianEgyptianEnglishEstonianEthiopianEuropeanFijianFilipinoFinnishFrenchFrench American IndianFrench CanadianGermanGerman RussianGhanaianGreekGuamanian/ChamorroGuatemalanGuyaneseHaitianHmongHopiHoumaHungarianIcelanderIndian (Asian)IndonesianInupiatIranianIraqiIrishIroquoisIsraeliItalianJamaicanJapaneseJordanianKenyanKiowaKoreanLaotianLatvianLebaneseLiberianLithuanianLumbeeLuxembourgerMacedonianMalaysianMalteseMarshalleseMenomineeMexicanMexican American IndianMongolianMoroccanNative HawaiianNavajoNepaleseNew ZealanderNicaraguanNigerianNorthern EuropeanNorwegianOkinawanOsageOttawaPaiutePakistaniPalestinianPanamanianParaguayanPennsylvania GermanPeruvianPimaPolishPortuguesePotawatomiPuebloPuerto RicanPuget Sound SalishRomanianRussianSalvadoranSamoanScandinavianScotch-IrishScottishSeminoleSenegaleseSerbianShoshoneSierra LeoneanSiouxSlavicSlovakSloveneSomaliSouth AfricanSouth AmericanSouth American IndianSoviet UnionSpaniardSpanishSpanish AmericanSpanish American IndianSri LankanSubsaharan AfricanSudaneseSwedishSwissSyrianTaiwaneseThaiTlingit-HaidaTohono O'OdhamTonganTrinidadian and TobagonianTsimshianTurkishU.S. Virgin IslanderUgandanUkrainianUruguayanUteVenezuelanVietnameseWelshWest IndianYakamaYaquiYugoslavianYumanYup'ikZimbabwean
Immigration
NonimmigrantsImmigrantsAfghanistanAfricaAlbaniaArgentinaArmeniaAsiaAustraliaAustriaBahamasBangladeshBarbadosBelarusBelgiumBelizeBoliviaBosnia and HerzegovinaBrazilBulgariaBurma/MyanmarCabo VerdeCambodiaCameroonCanadaCaribbeanCentral AmericaChileChinaColombiaCongoCosta RicaCroatiaCubaCzechoslovakiaDenmarkDominicaDominican RepublicEastern AfricaEastern AsiaEastern EuropeEcuadorEgyptEl SalvadorEnglandEritreaEthiopiaEuropeFijiFranceGermanyGhanaGreeceGrenadaGuatemalaGuyanaHaitiHondurasHong KongHungaryIndiaIndonesiaIranIraqIrelandIsraelItalyJamaicaJapanJordanKazakhstanKenyaKoreaKuwaitLaosLatin AmericaLatviaLebanonLiberiaLithuaniaMalaysiaMexicoMicronesiaMiddle AfricaMoldovaMoroccoNepalNetherlandsNicaraguaNigeriaNorth AmericaNorth MacedoniaNorthern AfricaNorthern EuropeNorwayOceaniaPakistanPanamaPeruPhilippinesPolandPortugalRomaniaRussiaSaudi ArabiaScotlandSenegalSerbiaSierra LeoneSingaporeSomaliaSouth AfricaSouth AmericaSouth Central AsiaSouth Eastern AsiaSouthern EuropeSpainSri LankaSt. Vincent and the GrenadinesSudanSwedenSwitzerlandSyriaTaiwanThailandTrinidad and TobagoTurkeyUgandaUkraineUruguayUzbekistanVenezuelaVietnamWest IndiesWestern AfricaWestern AsiaWestern EuropeYemenZaireZimbabweAzores
Honduran
Race
Ancestry
AfghanAfricanAlaska NativeAlaskan AthabascanAlbanianAleutAlsatianAmericanApacheArabArapahoArgentineanArmenianAssyrian/Chaldean/SyriacAustralianAustrianBahamianBangladeshiBarbadianBasqueBelgianBelizeanBermudanBhutaneseBlackfeetBolivianBrazilianBritish West IndianBulgarianBurmeseCajunCambodianCanadianCape VerdeanCarpatho RusynCelticCentral AmericanCentral American IndianCherokeeCheyenneChickasawChileanChineseChippewaChoctawColombianColvilleComancheCosta RicanCreeCreekCroatianCrowCubanCypriotCzechCzechoslovakianDanishDelawareDominicanDutchDutch West IndianEastern EuropeanEcuadorianEgyptianEnglishEstonianEthiopianEuropeanFijianFilipinoFinnishFrenchFrench American IndianFrench CanadianGermanGerman RussianGhanaianGreekGuamanian/ChamorroGuatemalanGuyaneseHaitianHmongHonduranHopiHoumaHungarianIcelanderIndian (Asian)IndonesianInupiatIranianIraqiIrishIroquoisIsraeliItalianJamaicanJapaneseJordanianKenyanKiowaKoreanLaotianLatvianLebaneseLiberianLithuanianLumbeeLuxembourgerMacedonianMalaysianMalteseMarshalleseMenomineeMexicanMexican American IndianMongolianMoroccanNative HawaiianNavajoNepaleseNew ZealanderNicaraguanNigerianNorthern EuropeanNorwegianOkinawanOsageOttawaPaiutePakistaniPalestinianPanamanianParaguayanPennsylvania GermanPeruvianPimaPolishPortuguesePotawatomiPuebloPuerto RicanPuget Sound SalishRomanianRussianSalvadoranSamoanScandinavianScotch-IrishScottishSeminoleSenegaleseSerbianShoshoneSierra LeoneanSiouxSlavicSlovakSloveneSomaliSouth AfricanSouth AmericanSouth American IndianSoviet UnionSpaniardSpanishSpanish AmericanSpanish American IndianSri LankanSubsaharan AfricanSudaneseSwedishSwissSyrianTaiwaneseThaiTlingit-HaidaTohono O'OdhamTonganTrinidadian and TobagonianTsimshianTurkishU.S. Virgin IslanderUgandanUkrainianUruguayanUteVenezuelanVietnameseWelshWest IndianYakamaYaquiYugoslavianYumanYup'ikZimbabwean
Immigration
NonimmigrantsImmigrantsAfghanistanAfricaAlbaniaArgentinaArmeniaAsiaAustraliaAustriaBahamasBangladeshBarbadosBelarusBelgiumBelizeBoliviaBosnia and HerzegovinaBrazilBulgariaBurma/MyanmarCabo VerdeCambodiaCameroonCanadaCaribbeanCentral AmericaChileChinaColombiaCongoCosta RicaCroatiaCubaCzechoslovakiaDenmarkDominicaDominican RepublicEastern AfricaEastern AsiaEastern EuropeEcuadorEgyptEl SalvadorEnglandEritreaEthiopiaEuropeFijiFranceGermanyGhanaGreeceGrenadaGuatemalaGuyanaHaitiHondurasHong KongHungaryIndiaIndonesiaIranIraqIrelandIsraelItalyJamaicaJapanJordanKazakhstanKenyaKoreaKuwaitLaosLatin AmericaLatviaLebanonLiberiaLithuaniaMalaysiaMexicoMicronesiaMiddle AfricaMoldovaMoroccoNepalNetherlandsNicaraguaNigeriaNorth AmericaNorth MacedoniaNorthern AfricaNorthern EuropeNorwayOceaniaPakistanPanamaPeruPhilippinesPolandPortugalRomaniaRussiaSaudi ArabiaScotlandSenegalSerbiaSierra LeoneSingaporeSomaliaSouth AfricaSouth AmericaSouth Central AsiaSouth Eastern AsiaSouthern EuropeSpainSri LankaSt. Vincent and the GrenadinesSudanSwedenSwitzerlandSyriaTaiwanThailandTrinidad and TobagoTurkeyUgandaUkraineUruguayUzbekistanVenezuelaVietnamWest IndiesWestern AfricaWestern AsiaWestern EuropeYemenZaireZimbabweAzores
Unemployment Among Women with Children Under 18 years
Income
Poverty
Unemployment
Labor Participation
Family Structure
Vehicle Availability
Education Level
Disability

Unemployment Among Women with Children Under 18 years Comparison

British

Hondurans

Exceptional
Tragic
5.0%
UNEMPLOYMENT AMONG WOMEN WITH CHILDREN UNDER 18 YEARS
98.7/ 100
METRIC RATING
47th/ 347
METRIC RANK
6.4%
UNEMPLOYMENT AMONG WOMEN WITH CHILDREN UNDER 18 YEARS
0.0/ 100
METRIC RATING
294th/ 347
METRIC RANK

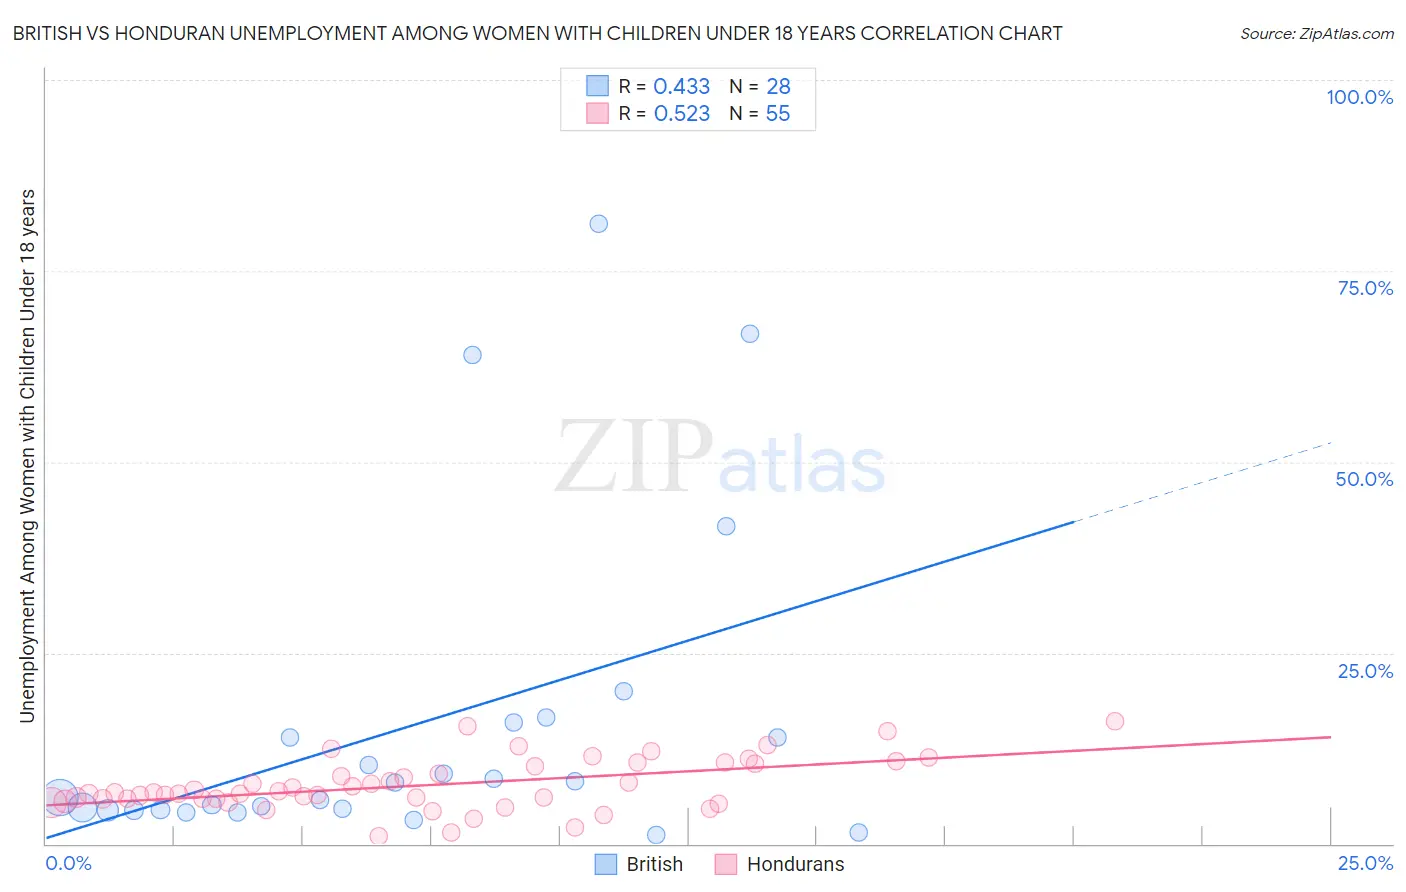
British vs Honduran Unemployment Among Women with Children Under 18 years Correlation Chart

The statistical analysis conducted on geographies consisting of 489,601,986 people shows a moderate positive correlation between the proportion of British and unemployment rate among women with children under the age of 18 in the United States with a correlation coefficient (R) of 0.433 and weighted average of 5.0%. Similarly, the statistical analysis conducted on geographies consisting of 348,078,554 people shows a substantial positive correlation between the proportion of Hondurans and unemployment rate among women with children under the age of 18 in the United States with a correlation coefficient (R) of 0.523 and weighted average of 6.4%, a difference of 26.8%.
British vs Honduran Unemployment Among Women with Children Under 18 years

Unemployment Among Women with Children Under 18 years Correlation Summary

MeasurementBritishHonduran
Minimum1.1%0.93%
Maximum81.2%16.0%
Range80.1%15.1%
Mean15.6%7.7%
Median7.0%6.7%
Interquartile 25% (IQ1)4.5%5.8%
Interquartile 75% (IQ3)14.9%10.4%
Interquartile Range (IQR)10.5%4.6%
Standard Deviation (Sample)21.1%3.4%
Standard Deviation (Population)20.7%3.3%

Similar Demographics by Unemployment Among Women with Children Under 18 years

Demographics Similar to British by Unemployment Among Women with Children Under 18 years

In terms of unemployment among women with children under 18 years, the demographic groups most similar to British are Immigrants from Korea (5.0%, a difference of 0.13%), Northern European (5.0%, a difference of 0.13%), Immigrants from Malaysia (5.0%, a difference of 0.24%), Immigrants from Moldova (5.0%, a difference of 0.32%), and Lithuanian (5.0%, a difference of 0.35%).
DemographicsRating | RankUnemployment Among Women with Children Under 18 years
Greeks
99.0
/100
|
#40
Exceptional
5.0%
Immigrants | Bosnia and Herzegovina
99.0
/100
|
#41
Exceptional
5.0%
Eastern Europeans
98.9
/100
|
#42
Exceptional
5.0%
Turks
98.9
/100
|
#43
Exceptional
5.0%
Immigrants | Moldova
98.9
/100
|
#44
Exceptional
5.0%
Immigrants | Malaysia
98.8
/100
|
#45
Exceptional
5.0%
Immigrants | Korea
98.7
/100
|
#46
Exceptional
5.0%
British
98.7
/100
|
#47
Exceptional
5.0%
Northern Europeans
98.6
/100
|
#48
Exceptional
5.0%
Lithuanians
98.4
/100
|
#49
Exceptional
5.0%
Immigrants | Japan
98.4
/100
|
#50
Exceptional
5.0%
Yugoslavians
98.3
/100
|
#51
Exceptional
5.1%
Immigrants | Nepal
98.3
/100
|
#52
Exceptional
5.1%
Scottish
98.2
/100
|
#53
Exceptional
5.1%
Immigrants | Serbia
98.2
/100
|
#54
Exceptional
5.1%

Demographics Similar to Hondurans by Unemployment Among Women with Children Under 18 years

In terms of unemployment among women with children under 18 years, the demographic groups most similar to Hondurans are Immigrants from Bangladesh (6.4%, a difference of 0.030%), Mexican (6.4%, a difference of 0.060%), Barbadian (6.4%, a difference of 0.080%), Haitian (6.4%, a difference of 0.10%), and Immigrants from Guatemala (6.4%, a difference of 0.12%).
DemographicsRating | RankUnemployment Among Women with Children Under 18 years
Kiowa
0.0
/100
|
#287
Tragic
6.3%
Cree
0.0
/100
|
#288
Tragic
6.3%
Immigrants | Caribbean
0.0
/100
|
#289
Tragic
6.4%
Blackfeet
0.0
/100
|
#290
Tragic
6.4%
Immigrants | Guatemala
0.0
/100
|
#291
Tragic
6.4%
Mexicans
0.0
/100
|
#292
Tragic
6.4%
Immigrants | Bangladesh
0.0
/100
|
#293
Tragic
6.4%
Hondurans
0.0
/100
|
#294
Tragic
6.4%
Barbadians
0.0
/100
|
#295
Tragic
6.4%
Haitians
0.0
/100
|
#296
Tragic
6.4%
Immigrants | Senegal
0.0
/100
|
#297
Tragic
6.4%
Immigrants | Latin America
0.0
/100
|
#298
Tragic
6.4%
Jamaicans
0.0
/100
|
#299
Tragic
6.4%
Immigrants | Jamaica
0.0
/100
|
#300
Tragic
6.4%
Immigrants | Haiti
0.0
/100
|
#301
Tragic
6.4%