Pueblo vs Honduran Unemployment Among Women with Children Under 18 years
COMPARE
Pueblo
Honduran
Unemployment Among Women with Children Under 18 years
Unemployment Among Women with Children Under 18 years Comparison
Pueblo
Hondurans
6.8%
UNEMPLOYMENT AMONG WOMEN WITH CHILDREN UNDER 18 YEARS
0.0/ 100
METRIC RATING
323rd/ 347
METRIC RANK
6.4%
UNEMPLOYMENT AMONG WOMEN WITH CHILDREN UNDER 18 YEARS
0.0/ 100
METRIC RATING
294th/ 347
METRIC RANK
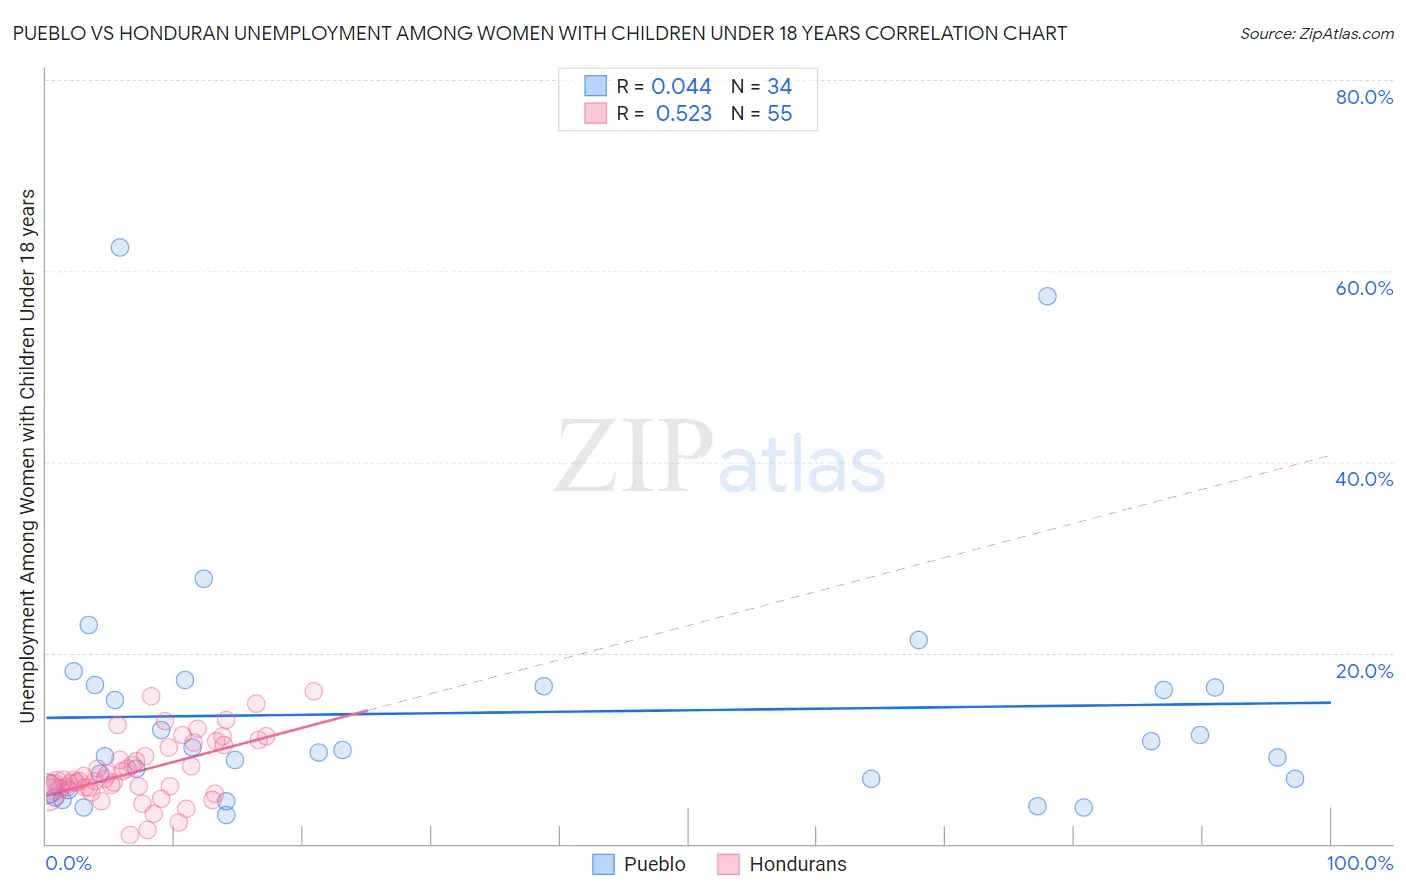
Pueblo vs Honduran Unemployment Among Women with Children Under 18 years Correlation Chart
The statistical analysis conducted on geographies consisting of 118,285,687 people shows no correlation between the proportion of Pueblo and unemployment rate among women with children under the age of 18 in the United States with a correlation coefficient (R) of 0.044 and weighted average of 6.8%. Similarly, the statistical analysis conducted on geographies consisting of 348,078,554 people shows a substantial positive correlation between the proportion of Hondurans and unemployment rate among women with children under the age of 18 in the United States with a correlation coefficient (R) of 0.523 and weighted average of 6.4%, a difference of 7.0%.
Unemployment Among Women with Children Under 18 years Correlation Summary
| Measurement | Pueblo | Honduran |
| Minimum | 3.0% | 0.93% |
| Maximum | 62.5% | 16.0% |
| Range | 59.5% | 15.1% |
| Mean | 13.7% | 7.7% |
| Median | 9.7% | 6.7% |
| Interquartile 25% (IQ1) | 5.8% | 5.8% |
| Interquartile 75% (IQ3) | 16.5% | 10.4% |
| Interquartile Range (IQR) | 10.7% | 4.6% |
| Standard Deviation (Sample) | 13.2% | 3.4% |
| Standard Deviation (Population) | 13.0% | 3.3% |
Similar Demographics by Unemployment Among Women with Children Under 18 years
Demographics Similar to Pueblo by Unemployment Among Women with Children Under 18 years
In terms of unemployment among women with children under 18 years, the demographic groups most similar to Pueblo are Houma (6.8%, a difference of 0.19%), Paiute (6.9%, a difference of 0.93%), U.S. Virgin Islander (6.7%, a difference of 2.1%), Immigrants from Dominica (7.0%, a difference of 2.1%), and Immigrants from Belize (6.7%, a difference of 2.2%).
| Demographics | Rating | Rank | Unemployment Among Women with Children Under 18 years |
| Immigrants | Ecuador | 0.0 /100 | #316 | Tragic 6.6% |
| Shoshone | 0.0 /100 | #317 | Tragic 6.6% |
| Alaska Natives | 0.0 /100 | #318 | Tragic 6.7% |
| Central American Indians | 0.0 /100 | #319 | Tragic 6.7% |
| Immigrants | Belize | 0.0 /100 | #320 | Tragic 6.7% |
| U.S. Virgin Islanders | 0.0 /100 | #321 | Tragic 6.7% |
| Houma | 0.0 /100 | #322 | Tragic 6.8% |
| Pueblo | 0.0 /100 | #323 | Tragic 6.8% |
| Paiute | 0.0 /100 | #324 | Tragic 6.9% |
| Immigrants | Dominica | 0.0 /100 | #325 | Tragic 7.0% |
| Chippewa | 0.0 /100 | #326 | Tragic 7.0% |
| Lumbee | 0.0 /100 | #327 | Tragic 7.1% |
| Natives/Alaskans | 0.0 /100 | #328 | Tragic 7.2% |
| Blacks/African Americans | 0.0 /100 | #329 | Tragic 7.3% |
| Colville | 0.0 /100 | #330 | Tragic 7.4% |
Demographics Similar to Hondurans by Unemployment Among Women with Children Under 18 years
In terms of unemployment among women with children under 18 years, the demographic groups most similar to Hondurans are Immigrants from Bangladesh (6.4%, a difference of 0.030%), Mexican (6.4%, a difference of 0.060%), Barbadian (6.4%, a difference of 0.080%), Haitian (6.4%, a difference of 0.10%), and Immigrants from Guatemala (6.4%, a difference of 0.12%).
| Demographics | Rating | Rank | Unemployment Among Women with Children Under 18 years |
| Kiowa | 0.0 /100 | #287 | Tragic 6.3% |
| Cree | 0.0 /100 | #288 | Tragic 6.3% |
| Immigrants | Caribbean | 0.0 /100 | #289 | Tragic 6.4% |
| Blackfeet | 0.0 /100 | #290 | Tragic 6.4% |
| Immigrants | Guatemala | 0.0 /100 | #291 | Tragic 6.4% |
| Mexicans | 0.0 /100 | #292 | Tragic 6.4% |
| Immigrants | Bangladesh | 0.0 /100 | #293 | Tragic 6.4% |
| Hondurans | 0.0 /100 | #294 | Tragic 6.4% |
| Barbadians | 0.0 /100 | #295 | Tragic 6.4% |
| Haitians | 0.0 /100 | #296 | Tragic 6.4% |
| Immigrants | Senegal | 0.0 /100 | #297 | Tragic 6.4% |
| Immigrants | Latin America | 0.0 /100 | #298 | Tragic 6.4% |
| Jamaicans | 0.0 /100 | #299 | Tragic 6.4% |
| Immigrants | Jamaica | 0.0 /100 | #300 | Tragic 6.4% |
| Immigrants | Haiti | 0.0 /100 | #301 | Tragic 6.4% |