Bolivian vs German Unemployment Among Ages 16 to 19 years
COMPARE
Bolivian
German
Unemployment Among Ages 16 to 19 years
Unemployment Among Ages 16 to 19 years Comparison
Bolivians
Germans
17.3%
UNEMPLOYMENT AMONG AGES 16 TO 19 YEARS
81.9/ 100
METRIC RATING
138th/ 347
METRIC RANK
15.7%
UNEMPLOYMENT AMONG AGES 16 TO 19 YEARS
100.0/ 100
METRIC RATING
16th/ 347
METRIC RANK
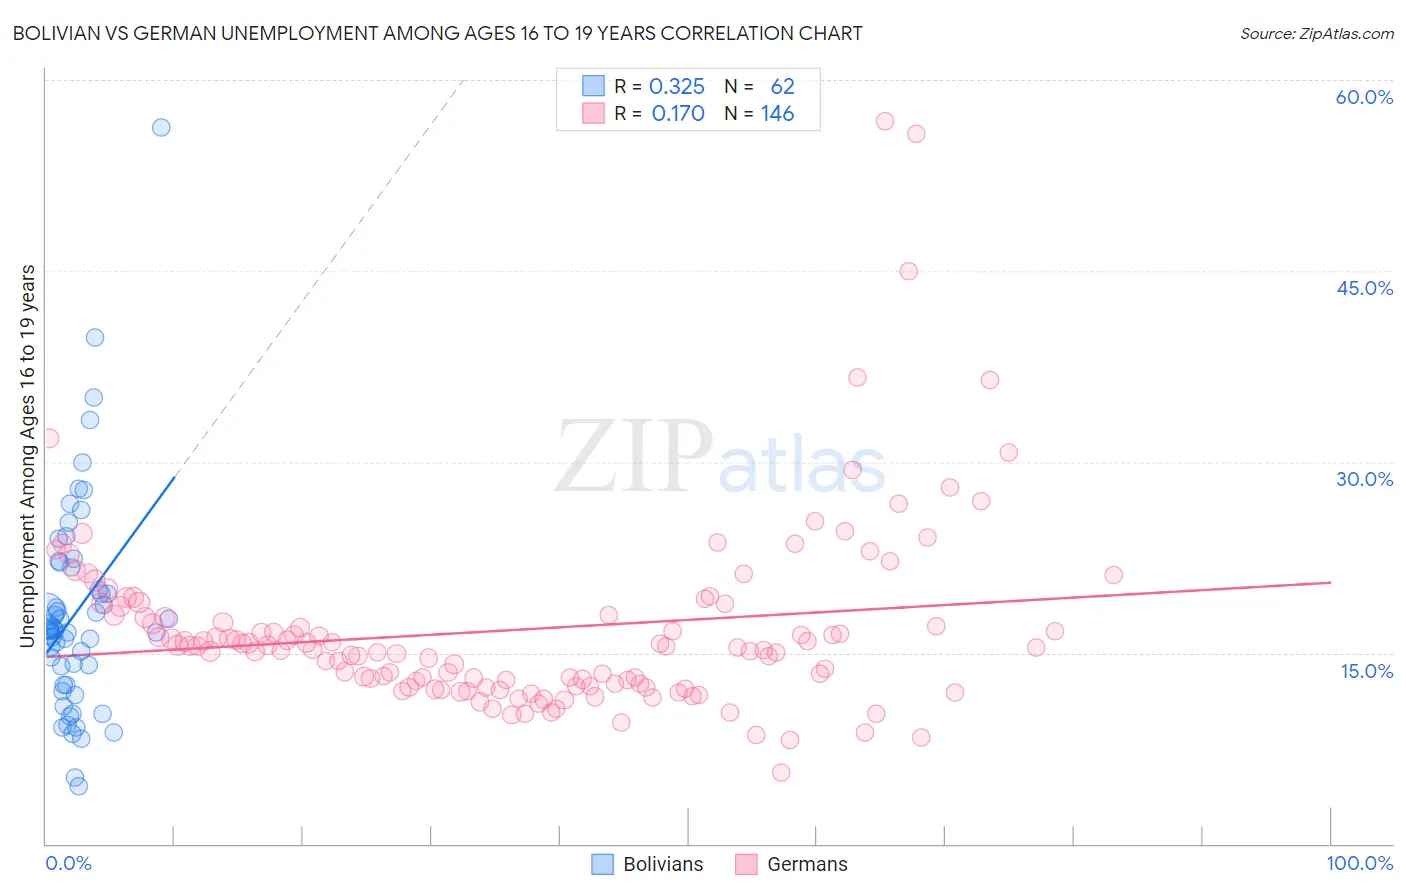
Bolivian vs German Unemployment Among Ages 16 to 19 years Correlation Chart
The statistical analysis conducted on geographies consisting of 179,875,457 people shows a mild positive correlation between the proportion of Bolivians and unemployment rate among population between the ages 16 and 19 in the United States with a correlation coefficient (R) of 0.325 and weighted average of 17.3%. Similarly, the statistical analysis conducted on geographies consisting of 512,682,712 people shows a poor positive correlation between the proportion of Germans and unemployment rate among population between the ages 16 and 19 in the United States with a correlation coefficient (R) of 0.170 and weighted average of 15.7%, a difference of 10.2%.
Unemployment Among Ages 16 to 19 years Correlation Summary
| Measurement | Bolivian | German |
| Minimum | 4.5% | 5.6% |
| Maximum | 56.3% | 56.8% |
| Range | 51.8% | 51.2% |
| Mean | 18.1% | 16.8% |
| Median | 16.8% | 15.4% |
| Interquartile 25% (IQ1) | 12.5% | 12.4% |
| Interquartile 75% (IQ3) | 21.7% | 18.0% |
| Interquartile Range (IQR) | 9.2% | 5.6% |
| Standard Deviation (Sample) | 8.6% | 7.4% |
| Standard Deviation (Population) | 8.5% | 7.4% |
Similar Demographics by Unemployment Among Ages 16 to 19 years
Demographics Similar to Bolivians by Unemployment Among Ages 16 to 19 years
In terms of unemployment among ages 16 to 19 years, the demographic groups most similar to Bolivians are Immigrants from Malaysia (17.2%, a difference of 0.070%), Immigrants from Eritrea (17.3%, a difference of 0.070%), Immigrants from Croatia (17.3%, a difference of 0.090%), Immigrants from Oceania (17.2%, a difference of 0.10%), and Basque (17.3%, a difference of 0.10%).
| Demographics | Rating | Rank | Unemployment Among Ages 16 to 19 years |
| German Russians | 84.1 /100 | #131 | Excellent 17.2% |
| Arabs | 83.9 /100 | #132 | Excellent 17.2% |
| Laotians | 83.9 /100 | #133 | Excellent 17.2% |
| Potawatomi | 83.8 /100 | #134 | Excellent 17.2% |
| Samoans | 83.7 /100 | #135 | Excellent 17.2% |
| Immigrants | Oceania | 83.1 /100 | #136 | Excellent 17.2% |
| Immigrants | Malaysia | 82.8 /100 | #137 | Excellent 17.2% |
| Bolivians | 81.9 /100 | #138 | Excellent 17.3% |
| Immigrants | Eritrea | 81.1 /100 | #139 | Excellent 17.3% |
| Immigrants | Croatia | 80.8 /100 | #140 | Excellent 17.3% |
| Basques | 80.7 /100 | #141 | Excellent 17.3% |
| Spanish | 79.3 /100 | #142 | Good 17.3% |
| Immigrants | Egypt | 79.1 /100 | #143 | Good 17.3% |
| Immigrants | England | 78.9 /100 | #144 | Good 17.3% |
| Indians (Asian) | 77.6 /100 | #145 | Good 17.3% |
Demographics Similar to Germans by Unemployment Among Ages 16 to 19 years
In terms of unemployment among ages 16 to 19 years, the demographic groups most similar to Germans are Somali (15.7%, a difference of 0.21%), Yugoslavian (15.6%, a difference of 0.29%), Immigrants from Zaire (15.6%, a difference of 0.34%), Thai (15.7%, a difference of 0.45%), and Immigrants from Burma/Myanmar (15.6%, a difference of 0.49%).
| Demographics | Rating | Rank | Unemployment Among Ages 16 to 19 years |
| Scandinavians | 100.0 /100 | #9 | Exceptional 15.4% |
| Zimbabweans | 100.0 /100 | #10 | Exceptional 15.4% |
| Indonesians | 100.0 /100 | #11 | Exceptional 15.5% |
| Taiwanese | 100.0 /100 | #12 | Exceptional 15.5% |
| Immigrants | Burma/Myanmar | 100.0 /100 | #13 | Exceptional 15.6% |
| Immigrants | Zaire | 100.0 /100 | #14 | Exceptional 15.6% |
| Yugoslavians | 100.0 /100 | #15 | Exceptional 15.6% |
| Germans | 100.0 /100 | #16 | Exceptional 15.7% |
| Somalis | 100.0 /100 | #17 | Exceptional 15.7% |
| Thais | 100.0 /100 | #18 | Exceptional 15.7% |
| Swiss | 100.0 /100 | #19 | Exceptional 15.8% |
| Sudanese | 100.0 /100 | #20 | Exceptional 15.8% |
| Immigrants | Taiwan | 100.0 /100 | #21 | Exceptional 15.8% |
| Finns | 100.0 /100 | #22 | Exceptional 15.9% |
| Belgians | 100.0 /100 | #23 | Exceptional 15.9% |