Bolivian vs Immigrants from Uzbekistan Unemployment Among Ages 16 to 19 years
COMPARE
Bolivian
Immigrants from Uzbekistan
Unemployment Among Ages 16 to 19 years
Unemployment Among Ages 16 to 19 years Comparison
Bolivians
Immigrants from Uzbekistan
17.3%
UNEMPLOYMENT AMONG AGES 16 TO 19 YEARS
81.9/ 100
METRIC RATING
138th/ 347
METRIC RANK
20.5%
UNEMPLOYMENT AMONG AGES 16 TO 19 YEARS
0.0/ 100
METRIC RATING
299th/ 347
METRIC RANK
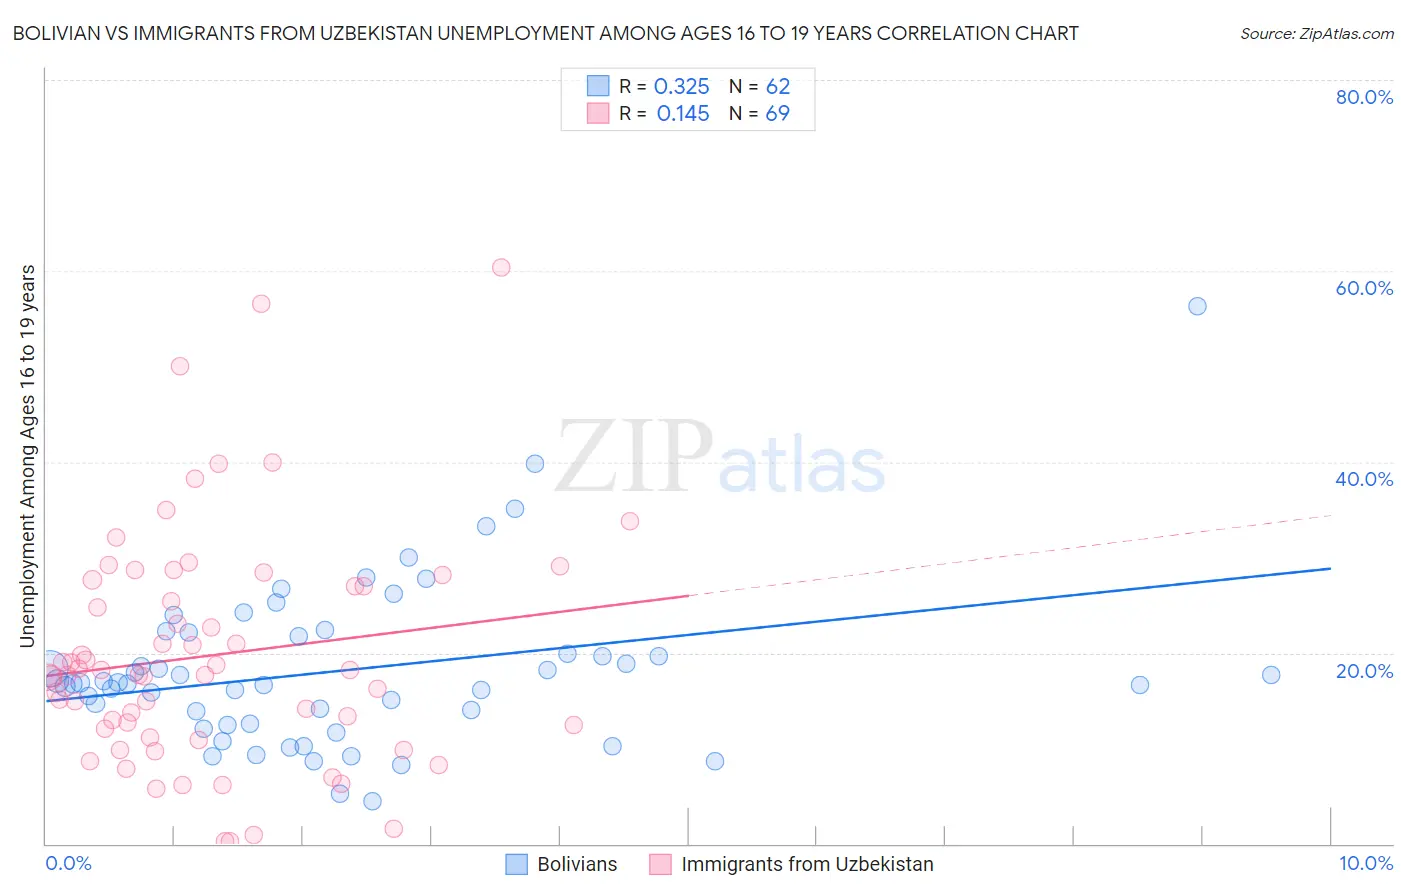
Bolivian vs Immigrants from Uzbekistan Unemployment Among Ages 16 to 19 years Correlation Chart
The statistical analysis conducted on geographies consisting of 179,875,457 people shows a mild positive correlation between the proportion of Bolivians and unemployment rate among population between the ages 16 and 19 in the United States with a correlation coefficient (R) of 0.325 and weighted average of 17.3%. Similarly, the statistical analysis conducted on geographies consisting of 116,067,277 people shows a poor positive correlation between the proportion of Immigrants from Uzbekistan and unemployment rate among population between the ages 16 and 19 in the United States with a correlation coefficient (R) of 0.145 and weighted average of 20.5%, a difference of 18.9%.
Unemployment Among Ages 16 to 19 years Correlation Summary
| Measurement | Bolivian | Immigrants from Uzbekistan |
| Minimum | 4.5% | 0.30% |
| Maximum | 56.3% | 60.4% |
| Range | 51.8% | 60.1% |
| Mean | 18.1% | 19.7% |
| Median | 16.8% | 17.7% |
| Interquartile 25% (IQ1) | 12.5% | 11.6% |
| Interquartile 75% (IQ3) | 21.7% | 27.3% |
| Interquartile Range (IQR) | 9.2% | 15.7% |
| Standard Deviation (Sample) | 8.6% | 12.2% |
| Standard Deviation (Population) | 8.5% | 12.1% |
Similar Demographics by Unemployment Among Ages 16 to 19 years
Demographics Similar to Bolivians by Unemployment Among Ages 16 to 19 years
In terms of unemployment among ages 16 to 19 years, the demographic groups most similar to Bolivians are Immigrants from Malaysia (17.2%, a difference of 0.070%), Immigrants from Eritrea (17.3%, a difference of 0.070%), Immigrants from Croatia (17.3%, a difference of 0.090%), Immigrants from Oceania (17.2%, a difference of 0.10%), and Basque (17.3%, a difference of 0.10%).
| Demographics | Rating | Rank | Unemployment Among Ages 16 to 19 years |
| German Russians | 84.1 /100 | #131 | Excellent 17.2% |
| Arabs | 83.9 /100 | #132 | Excellent 17.2% |
| Laotians | 83.9 /100 | #133 | Excellent 17.2% |
| Potawatomi | 83.8 /100 | #134 | Excellent 17.2% |
| Samoans | 83.7 /100 | #135 | Excellent 17.2% |
| Immigrants | Oceania | 83.1 /100 | #136 | Excellent 17.2% |
| Immigrants | Malaysia | 82.8 /100 | #137 | Excellent 17.2% |
| Bolivians | 81.9 /100 | #138 | Excellent 17.3% |
| Immigrants | Eritrea | 81.1 /100 | #139 | Excellent 17.3% |
| Immigrants | Croatia | 80.8 /100 | #140 | Excellent 17.3% |
| Basques | 80.7 /100 | #141 | Excellent 17.3% |
| Spanish | 79.3 /100 | #142 | Good 17.3% |
| Immigrants | Egypt | 79.1 /100 | #143 | Good 17.3% |
| Immigrants | England | 78.9 /100 | #144 | Good 17.3% |
| Indians (Asian) | 77.6 /100 | #145 | Good 17.3% |
Demographics Similar to Immigrants from Uzbekistan by Unemployment Among Ages 16 to 19 years
In terms of unemployment among ages 16 to 19 years, the demographic groups most similar to Immigrants from Uzbekistan are Haitian (20.5%, a difference of 0.050%), Ecuadorian (20.5%, a difference of 0.080%), Alsatian (20.5%, a difference of 0.11%), Armenian (20.5%, a difference of 0.13%), and Central American Indian (20.4%, a difference of 0.43%).
| Demographics | Rating | Rank | Unemployment Among Ages 16 to 19 years |
| Comanche | 0.0 /100 | #292 | Tragic 20.2% |
| Immigrants | Bahamas | 0.0 /100 | #293 | Tragic 20.4% |
| Immigrants | Haiti | 0.0 /100 | #294 | Tragic 20.4% |
| Central American Indians | 0.0 /100 | #295 | Tragic 20.4% |
| Armenians | 0.0 /100 | #296 | Tragic 20.5% |
| Alsatians | 0.0 /100 | #297 | Tragic 20.5% |
| Haitians | 0.0 /100 | #298 | Tragic 20.5% |
| Immigrants | Uzbekistan | 0.0 /100 | #299 | Tragic 20.5% |
| Ecuadorians | 0.0 /100 | #300 | Tragic 20.5% |
| Immigrants | Ecuador | 0.0 /100 | #301 | Tragic 20.9% |
| Immigrants | Caribbean | 0.0 /100 | #302 | Tragic 20.9% |
| Senegalese | 0.0 /100 | #303 | Tragic 21.0% |
| Aleuts | 0.0 /100 | #304 | Tragic 21.2% |
| Immigrants | Senegal | 0.0 /100 | #305 | Tragic 21.2% |
| U.S. Virgin Islanders | 0.0 /100 | #306 | Tragic 21.3% |