Immigrants from Cabo Verde vs German Unemployment Among Ages 16 to 19 years
COMPARE
Immigrants from Cabo Verde
German
Unemployment Among Ages 16 to 19 years
Unemployment Among Ages 16 to 19 years Comparison
Immigrants from Cabo Verde
Germans
18.4%
UNEMPLOYMENT AMONG AGES 16 TO 19 YEARS
2.0/ 100
METRIC RATING
240th/ 347
METRIC RANK
15.7%
UNEMPLOYMENT AMONG AGES 16 TO 19 YEARS
100.0/ 100
METRIC RATING
16th/ 347
METRIC RANK
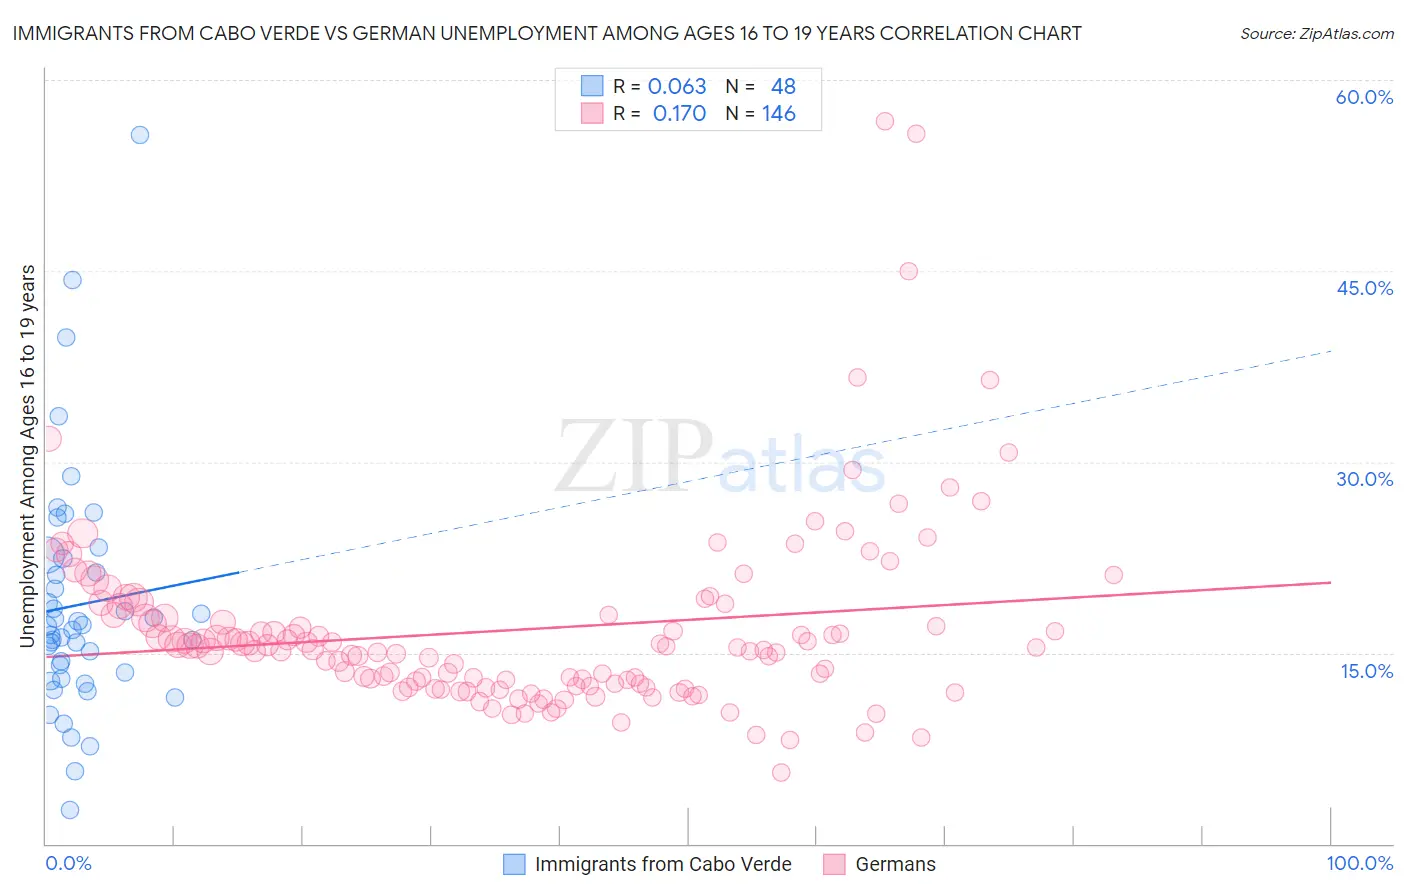
Immigrants from Cabo Verde vs German Unemployment Among Ages 16 to 19 years Correlation Chart
The statistical analysis conducted on geographies consisting of 37,702,404 people shows a slight positive correlation between the proportion of Immigrants from Cabo Verde and unemployment rate among population between the ages 16 and 19 in the United States with a correlation coefficient (R) of 0.063 and weighted average of 18.4%. Similarly, the statistical analysis conducted on geographies consisting of 512,682,712 people shows a poor positive correlation between the proportion of Germans and unemployment rate among population between the ages 16 and 19 in the United States with a correlation coefficient (R) of 0.170 and weighted average of 15.7%, a difference of 17.3%.
Unemployment Among Ages 16 to 19 years Correlation Summary
| Measurement | Immigrants from Cabo Verde | German |
| Minimum | 2.7% | 5.6% |
| Maximum | 55.7% | 56.8% |
| Range | 53.0% | 51.2% |
| Mean | 18.8% | 16.8% |
| Median | 17.0% | 15.4% |
| Interquartile 25% (IQ1) | 13.3% | 12.4% |
| Interquartile 75% (IQ3) | 21.9% | 18.0% |
| Interquartile Range (IQR) | 8.6% | 5.6% |
| Standard Deviation (Sample) | 9.5% | 7.4% |
| Standard Deviation (Population) | 9.4% | 7.4% |
Similar Demographics by Unemployment Among Ages 16 to 19 years
Demographics Similar to Immigrants from Cabo Verde by Unemployment Among Ages 16 to 19 years
In terms of unemployment among ages 16 to 19 years, the demographic groups most similar to Immigrants from Cabo Verde are Native Hawaiian (18.3%, a difference of 0.22%), South American (18.3%, a difference of 0.30%), Immigrants (18.3%, a difference of 0.32%), Immigrants from Colombia (18.3%, a difference of 0.33%), and French American Indian (18.3%, a difference of 0.40%).
| Demographics | Rating | Rank | Unemployment Among Ages 16 to 19 years |
| Seminole | 4.0 /100 | #233 | Tragic 18.2% |
| Colombians | 3.7 /100 | #234 | Tragic 18.3% |
| French American Indians | 2.9 /100 | #235 | Tragic 18.3% |
| Immigrants | Colombia | 2.7 /100 | #236 | Tragic 18.3% |
| Immigrants | Immigrants | 2.7 /100 | #237 | Tragic 18.3% |
| South Americans | 2.6 /100 | #238 | Tragic 18.3% |
| Native Hawaiians | 2.4 /100 | #239 | Tragic 18.3% |
| Immigrants | Cabo Verde | 2.0 /100 | #240 | Tragic 18.4% |
| Immigrants | Ukraine | 1.3 /100 | #241 | Tragic 18.5% |
| Moroccans | 1.1 /100 | #242 | Tragic 18.5% |
| Mexicans | 0.9 /100 | #243 | Tragic 18.5% |
| Guatemalans | 0.8 /100 | #244 | Tragic 18.6% |
| Immigrants | Belarus | 0.8 /100 | #245 | Tragic 18.6% |
| Immigrants | South America | 0.5 /100 | #246 | Tragic 18.7% |
| Immigrants | Israel | 0.5 /100 | #247 | Tragic 18.7% |
Demographics Similar to Germans by Unemployment Among Ages 16 to 19 years
In terms of unemployment among ages 16 to 19 years, the demographic groups most similar to Germans are Somali (15.7%, a difference of 0.21%), Yugoslavian (15.6%, a difference of 0.29%), Immigrants from Zaire (15.6%, a difference of 0.34%), Thai (15.7%, a difference of 0.45%), and Immigrants from Burma/Myanmar (15.6%, a difference of 0.49%).
| Demographics | Rating | Rank | Unemployment Among Ages 16 to 19 years |
| Scandinavians | 100.0 /100 | #9 | Exceptional 15.4% |
| Zimbabweans | 100.0 /100 | #10 | Exceptional 15.4% |
| Indonesians | 100.0 /100 | #11 | Exceptional 15.5% |
| Taiwanese | 100.0 /100 | #12 | Exceptional 15.5% |
| Immigrants | Burma/Myanmar | 100.0 /100 | #13 | Exceptional 15.6% |
| Immigrants | Zaire | 100.0 /100 | #14 | Exceptional 15.6% |
| Yugoslavians | 100.0 /100 | #15 | Exceptional 15.6% |
| Germans | 100.0 /100 | #16 | Exceptional 15.7% |
| Somalis | 100.0 /100 | #17 | Exceptional 15.7% |
| Thais | 100.0 /100 | #18 | Exceptional 15.7% |
| Swiss | 100.0 /100 | #19 | Exceptional 15.8% |
| Sudanese | 100.0 /100 | #20 | Exceptional 15.8% |
| Immigrants | Taiwan | 100.0 /100 | #21 | Exceptional 15.8% |
| Finns | 100.0 /100 | #22 | Exceptional 15.9% |
| Belgians | 100.0 /100 | #23 | Exceptional 15.9% |