Bolivian vs Immigrants from Saudi Arabia Unemployment Among Ages 20 to 24 years
COMPARE
Bolivian
Immigrants from Saudi Arabia
Unemployment Among Ages 20 to 24 years
Unemployment Among Ages 20 to 24 years Comparison
Bolivians
Immigrants from Saudi Arabia
9.9%
UNEMPLOYMENT AMONG AGES 20 TO 24 YEARS
98.9/ 100
METRIC RATING
72nd/ 347
METRIC RANK
9.7%
UNEMPLOYMENT AMONG AGES 20 TO 24 YEARS
99.9/ 100
METRIC RATING
42nd/ 347
METRIC RANK
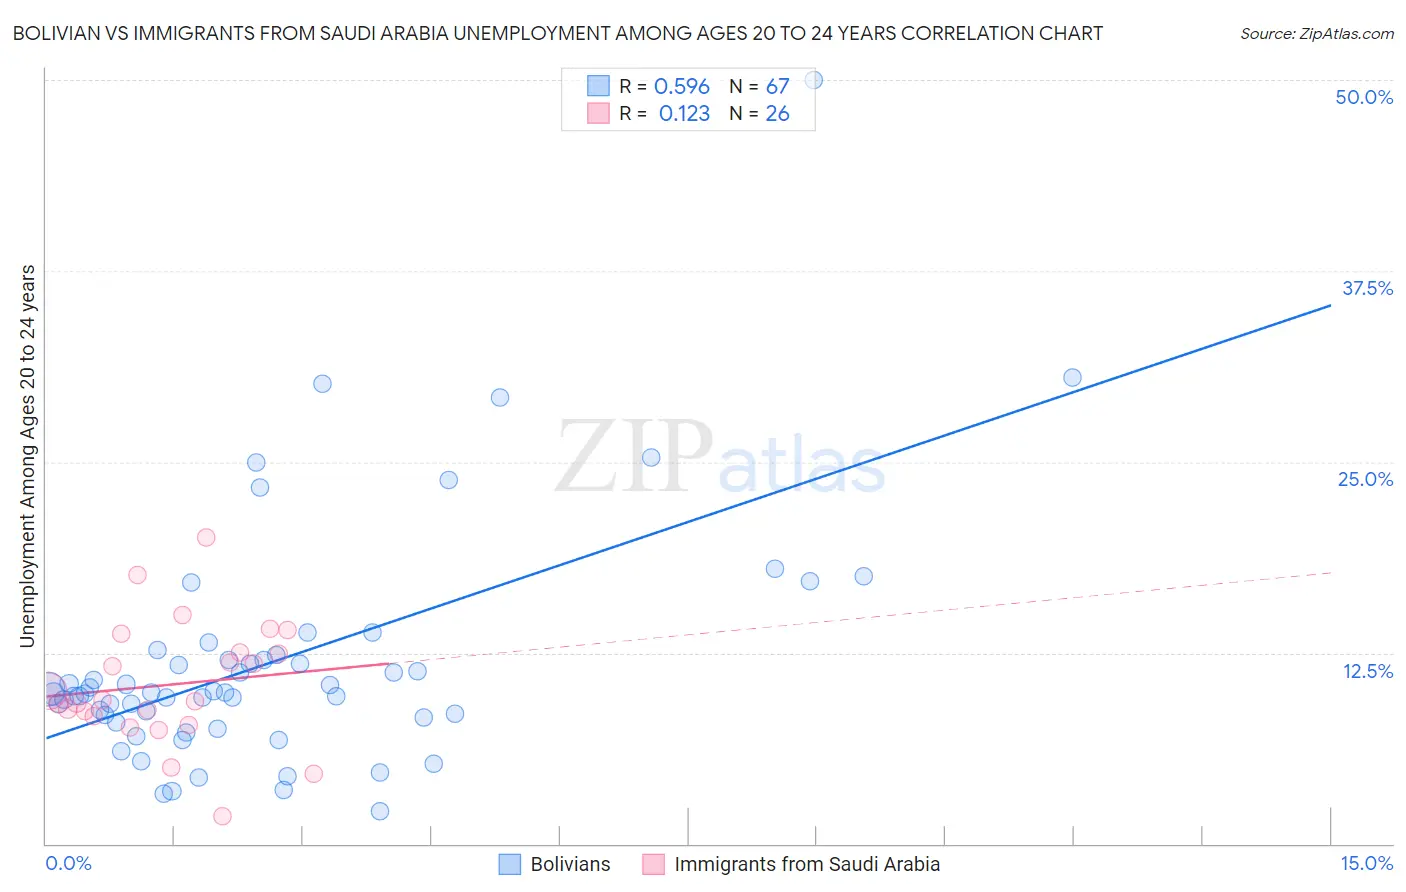
Bolivian vs Immigrants from Saudi Arabia Unemployment Among Ages 20 to 24 years Correlation Chart
The statistical analysis conducted on geographies consisting of 182,628,863 people shows a substantial positive correlation between the proportion of Bolivians and unemployment rate among population between the ages 20 and 24 in the United States with a correlation coefficient (R) of 0.596 and weighted average of 9.9%. Similarly, the statistical analysis conducted on geographies consisting of 163,142,127 people shows a poor positive correlation between the proportion of Immigrants from Saudi Arabia and unemployment rate among population between the ages 20 and 24 in the United States with a correlation coefficient (R) of 0.123 and weighted average of 9.7%, a difference of 2.1%.
Unemployment Among Ages 20 to 24 years Correlation Summary
| Measurement | Bolivian | Immigrants from Saudi Arabia |
| Minimum | 2.1% | 1.8% |
| Maximum | 50.0% | 20.1% |
| Range | 47.9% | 18.3% |
| Mean | 12.0% | 10.4% |
| Median | 9.9% | 9.4% |
| Interquartile 25% (IQ1) | 8.3% | 8.4% |
| Interquartile 75% (IQ3) | 12.4% | 12.5% |
| Interquartile Range (IQR) | 4.1% | 4.1% |
| Standard Deviation (Sample) | 7.9% | 4.0% |
| Standard Deviation (Population) | 7.8% | 3.9% |
Similar Demographics by Unemployment Among Ages 20 to 24 years
Demographics Similar to Bolivians by Unemployment Among Ages 20 to 24 years
In terms of unemployment among ages 20 to 24 years, the demographic groups most similar to Bolivians are Celtic (9.9%, a difference of 0.040%), Immigrants from Croatia (9.9%, a difference of 0.070%), Kenyan (9.9%, a difference of 0.14%), Immigrants from Laos (9.9%, a difference of 0.17%), and Bulgarian (9.9%, a difference of 0.19%).
| Demographics | Rating | Rank | Unemployment Among Ages 20 to 24 years |
| Welsh | 99.3 /100 | #65 | Exceptional 9.8% |
| Scottish | 99.3 /100 | #66 | Exceptional 9.8% |
| Immigrants | Bolivia | 99.2 /100 | #67 | Exceptional 9.9% |
| Mongolians | 99.1 /100 | #68 | Exceptional 9.9% |
| Bulgarians | 99.1 /100 | #69 | Exceptional 9.9% |
| Immigrants | Croatia | 99.0 /100 | #70 | Exceptional 9.9% |
| Celtics | 98.9 /100 | #71 | Exceptional 9.9% |
| Bolivians | 98.9 /100 | #72 | Exceptional 9.9% |
| Kenyans | 98.7 /100 | #73 | Exceptional 9.9% |
| Immigrants | Laos | 98.7 /100 | #74 | Exceptional 9.9% |
| Immigrants | Australia | 98.6 /100 | #75 | Exceptional 9.9% |
| Czechoslovakians | 98.4 /100 | #76 | Exceptional 9.9% |
| Chickasaw | 98.4 /100 | #77 | Exceptional 9.9% |
| Assyrians/Chaldeans/Syriacs | 98.3 /100 | #78 | Exceptional 9.9% |
| Icelanders | 98.3 /100 | #79 | Exceptional 9.9% |
Demographics Similar to Immigrants from Saudi Arabia by Unemployment Among Ages 20 to 24 years
In terms of unemployment among ages 20 to 24 years, the demographic groups most similar to Immigrants from Saudi Arabia are Swiss (9.7%, a difference of 0.080%), Menominee (9.7%, a difference of 0.16%), European (9.7%, a difference of 0.29%), Croatian (9.7%, a difference of 0.34%), and Immigrants from Nicaragua (9.7%, a difference of 0.36%).
| Demographics | Rating | Rank | Unemployment Among Ages 20 to 24 years |
| Germans | 100.0 /100 | #35 | Exceptional 9.6% |
| Belgians | 100.0 /100 | #36 | Exceptional 9.6% |
| Immigrants | Zaire | 100.0 /100 | #37 | Exceptional 9.6% |
| Afghans | 99.9 /100 | #38 | Exceptional 9.6% |
| Dutch | 99.9 /100 | #39 | Exceptional 9.6% |
| Immigrants | Ethiopia | 99.9 /100 | #40 | Exceptional 9.6% |
| Swiss | 99.9 /100 | #41 | Exceptional 9.7% |
| Immigrants | Saudi Arabia | 99.9 /100 | #42 | Exceptional 9.7% |
| Menominee | 99.8 /100 | #43 | Exceptional 9.7% |
| Europeans | 99.8 /100 | #44 | Exceptional 9.7% |
| Croatians | 99.8 /100 | #45 | Exceptional 9.7% |
| Immigrants | Nicaragua | 99.8 /100 | #46 | Exceptional 9.7% |
| Immigrants | India | 99.8 /100 | #47 | Exceptional 9.7% |
| Finns | 99.8 /100 | #48 | Exceptional 9.7% |
| Creek | 99.8 /100 | #49 | Exceptional 9.7% |