Blackfeet vs Immigrants from Sri Lanka Unemployment Among Ages 35 to 44 years
COMPARE
Blackfeet
Immigrants from Sri Lanka
Unemployment Among Ages 35 to 44 years
Unemployment Among Ages 35 to 44 years Comparison
Blackfeet
Immigrants from Sri Lanka
5.3%
UNEMPLOYMENT AMONG AGES 35 TO 44 YEARS
0.0/ 100
METRIC RATING
270th/ 347
METRIC RANK
4.3%
UNEMPLOYMENT AMONG AGES 35 TO 44 YEARS
99.1/ 100
METRIC RATING
33rd/ 347
METRIC RANK
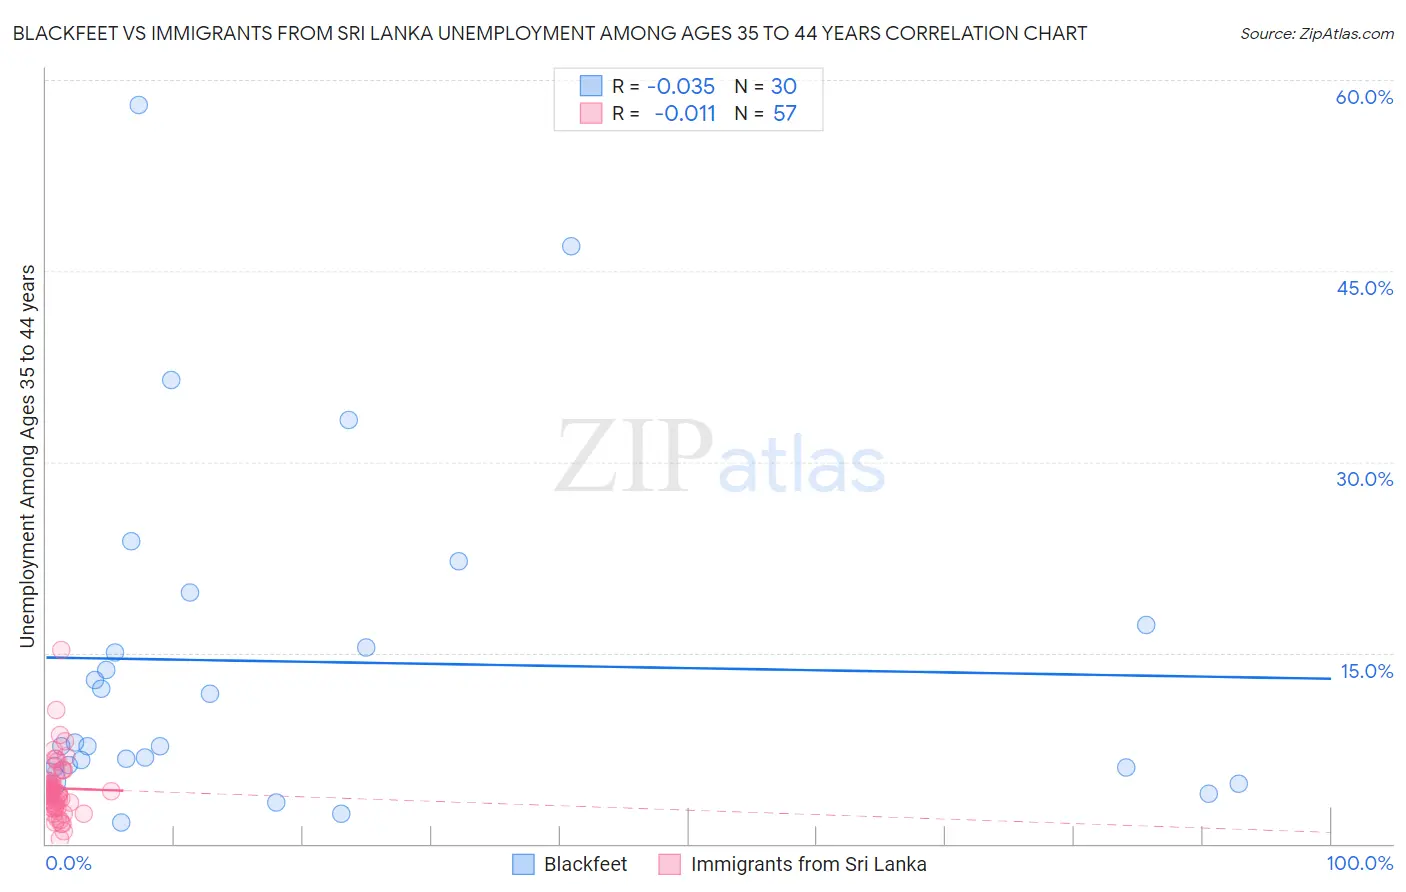
Blackfeet vs Immigrants from Sri Lanka Unemployment Among Ages 35 to 44 years Correlation Chart
The statistical analysis conducted on geographies consisting of 303,418,469 people shows no correlation between the proportion of Blackfeet and unemployment rate among population between the ages 35 and 44 in the United States with a correlation coefficient (R) of -0.035 and weighted average of 5.3%. Similarly, the statistical analysis conducted on geographies consisting of 148,943,009 people shows no correlation between the proportion of Immigrants from Sri Lanka and unemployment rate among population between the ages 35 and 44 in the United States with a correlation coefficient (R) of -0.011 and weighted average of 4.3%, a difference of 24.1%.
Unemployment Among Ages 35 to 44 years Correlation Summary
| Measurement | Blackfeet | Immigrants from Sri Lanka |
| Minimum | 1.7% | 0.40% |
| Maximum | 58.0% | 15.2% |
| Range | 56.3% | 14.8% |
| Mean | 14.3% | 4.4% |
| Median | 7.8% | 4.1% |
| Interquartile 25% (IQ1) | 6.0% | 2.9% |
| Interquartile 75% (IQ3) | 17.2% | 4.9% |
| Interquartile Range (IQR) | 11.2% | 2.0% |
| Standard Deviation (Sample) | 13.5% | 2.4% |
| Standard Deviation (Population) | 13.3% | 2.4% |
Similar Demographics by Unemployment Among Ages 35 to 44 years
Demographics Similar to Blackfeet by Unemployment Among Ages 35 to 44 years
In terms of unemployment among ages 35 to 44 years, the demographic groups most similar to Blackfeet are Cajun (5.3%, a difference of 0.14%), Hawaiian (5.3%, a difference of 0.15%), Ute (5.3%, a difference of 0.17%), Senegalese (5.3%, a difference of 0.18%), and Immigrants from Western Africa (5.3%, a difference of 0.23%).
| Demographics | Rating | Rank | Unemployment Among Ages 35 to 44 years |
| Choctaw | 0.1 /100 | #263 | Tragic 5.3% |
| Ghanaians | 0.1 /100 | #264 | Tragic 5.3% |
| Yaqui | 0.1 /100 | #265 | Tragic 5.3% |
| Immigrants | Bangladesh | 0.1 /100 | #266 | Tragic 5.3% |
| Immigrants | Western Africa | 0.0 /100 | #267 | Tragic 5.3% |
| Hawaiians | 0.0 /100 | #268 | Tragic 5.3% |
| Cajuns | 0.0 /100 | #269 | Tragic 5.3% |
| Blackfeet | 0.0 /100 | #270 | Tragic 5.3% |
| Ute | 0.0 /100 | #271 | Tragic 5.3% |
| Senegalese | 0.0 /100 | #272 | Tragic 5.3% |
| Vietnamese | 0.0 /100 | #273 | Tragic 5.4% |
| Creek | 0.0 /100 | #274 | Tragic 5.4% |
| Immigrants | Mexico | 0.0 /100 | #275 | Tragic 5.4% |
| Native Hawaiians | 0.0 /100 | #276 | Tragic 5.4% |
| Immigrants | Caribbean | 0.0 /100 | #277 | Tragic 5.4% |
Demographics Similar to Immigrants from Sri Lanka by Unemployment Among Ages 35 to 44 years
In terms of unemployment among ages 35 to 44 years, the demographic groups most similar to Immigrants from Sri Lanka are Chinese (4.3%, a difference of 0.11%), Jordanian (4.3%, a difference of 0.15%), Luxembourger (4.3%, a difference of 0.18%), Carpatho Rusyn (4.3%, a difference of 0.20%), and Immigrants from Pakistan (4.3%, a difference of 0.24%).
| Demographics | Rating | Rank | Unemployment Among Ages 35 to 44 years |
| Turks | 99.3 /100 | #26 | Exceptional 4.3% |
| Assyrians/Chaldeans/Syriacs | 99.3 /100 | #27 | Exceptional 4.3% |
| Immigrants | Japan | 99.3 /100 | #28 | Exceptional 4.3% |
| Europeans | 99.2 /100 | #29 | Exceptional 4.3% |
| Immigrants | Pakistan | 99.2 /100 | #30 | Exceptional 4.3% |
| Carpatho Rusyns | 99.2 /100 | #31 | Exceptional 4.3% |
| Chinese | 99.1 /100 | #32 | Exceptional 4.3% |
| Immigrants | Sri Lanka | 99.1 /100 | #33 | Exceptional 4.3% |
| Jordanians | 99.0 /100 | #34 | Exceptional 4.3% |
| Luxembourgers | 99.0 /100 | #35 | Exceptional 4.3% |
| Mongolians | 98.9 /100 | #36 | Exceptional 4.3% |
| Immigrants | Zimbabwe | 98.9 /100 | #37 | Exceptional 4.3% |
| Burmese | 98.9 /100 | #38 | Exceptional 4.3% |
| Palestinians | 98.8 /100 | #39 | Exceptional 4.3% |
| Zimbabweans | 98.8 /100 | #40 | Exceptional 4.3% |