Blackfeet vs Immigrants from Sri Lanka 1st Grade
COMPARE
Blackfeet
Immigrants from Sri Lanka
1st Grade
1st Grade Comparison
Blackfeet
Immigrants from Sri Lanka
98.1%
1ST GRADE
87.6/ 100
METRIC RATING
139th/ 347
METRIC RANK
97.9%
1ST GRADE
49.7/ 100
METRIC RATING
175th/ 347
METRIC RANK
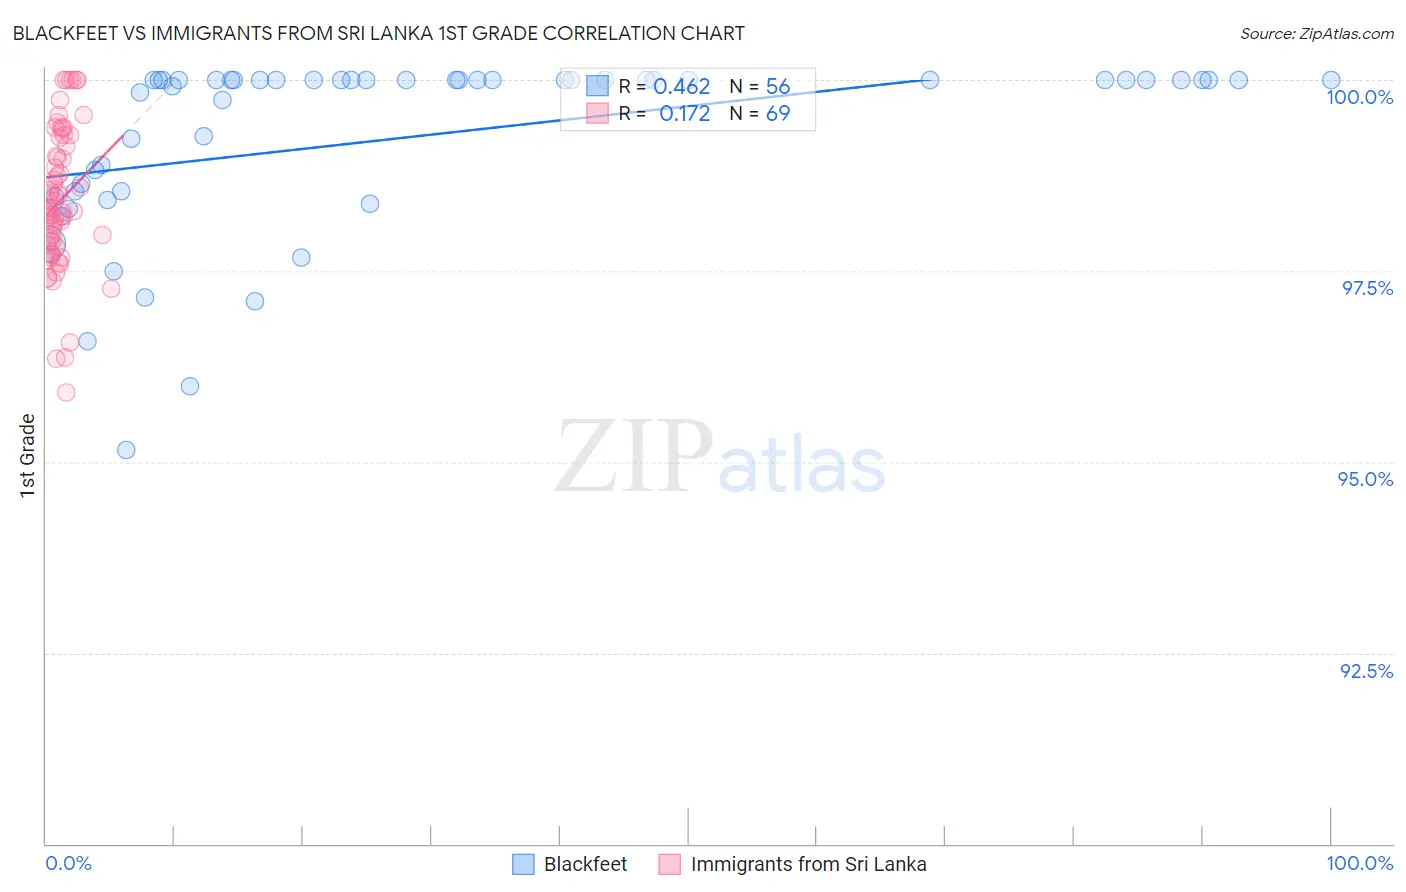
Blackfeet vs Immigrants from Sri Lanka 1st Grade Correlation Chart
The statistical analysis conducted on geographies consisting of 309,580,957 people shows a moderate positive correlation between the proportion of Blackfeet and percentage of population with at least 1st grade education in the United States with a correlation coefficient (R) of 0.462 and weighted average of 98.1%. Similarly, the statistical analysis conducted on geographies consisting of 149,700,552 people shows a poor positive correlation between the proportion of Immigrants from Sri Lanka and percentage of population with at least 1st grade education in the United States with a correlation coefficient (R) of 0.172 and weighted average of 97.9%, a difference of 0.15%.
1st Grade Correlation Summary
| Measurement | Blackfeet | Immigrants from Sri Lanka |
| Minimum | 95.2% | 95.9% |
| Maximum | 100.0% | 100.0% |
| Range | 4.8% | 4.1% |
| Mean | 99.3% | 98.4% |
| Median | 100.0% | 98.3% |
| Interquartile 25% (IQ1) | 98.5% | 97.8% |
| Interquartile 75% (IQ3) | 100.0% | 99.2% |
| Interquartile Range (IQR) | 1.5% | 1.4% |
| Standard Deviation (Sample) | 1.2% | 0.93% |
| Standard Deviation (Population) | 1.2% | 0.92% |
Similar Demographics by 1st Grade
Demographics Similar to Blackfeet by 1st Grade
In terms of 1st grade, the demographic groups most similar to Blackfeet are Israeli (98.1%, a difference of 0.0%), Immigrants from Romania (98.1%, a difference of 0.0%), Immigrants from Hungary (98.1%, a difference of 0.010%), Immigrants from Kuwait (98.1%, a difference of 0.010%), and Immigrants from Bulgaria (98.1%, a difference of 0.010%).
| Demographics | Rating | Rank | 1st Grade |
| Cambodians | 90.9 /100 | #132 | Exceptional 98.1% |
| Immigrants | Europe | 90.5 /100 | #133 | Exceptional 98.1% |
| Immigrants | Hungary | 89.4 /100 | #134 | Excellent 98.1% |
| Immigrants | Kuwait | 89.3 /100 | #135 | Excellent 98.1% |
| Immigrants | Bulgaria | 88.8 /100 | #136 | Excellent 98.1% |
| Israelis | 87.8 /100 | #137 | Excellent 98.1% |
| Immigrants | Romania | 87.8 /100 | #138 | Excellent 98.1% |
| Blackfeet | 87.6 /100 | #139 | Excellent 98.1% |
| Palestinians | 83.0 /100 | #140 | Excellent 98.0% |
| Immigrants | Turkey | 82.8 /100 | #141 | Excellent 98.0% |
| Marshallese | 82.0 /100 | #142 | Excellent 98.0% |
| Burmese | 81.0 /100 | #143 | Excellent 98.0% |
| Alsatians | 80.9 /100 | #144 | Excellent 98.0% |
| Hmong | 79.0 /100 | #145 | Good 98.0% |
| Immigrants | Israel | 77.8 /100 | #146 | Good 98.0% |
Demographics Similar to Immigrants from Sri Lanka by 1st Grade
In terms of 1st grade, the demographic groups most similar to Immigrants from Sri Lanka are Kenyan (97.9%, a difference of 0.0%), Native/Alaskan (97.9%, a difference of 0.0%), Albanian (97.9%, a difference of 0.0%), Immigrants from Brazil (97.9%, a difference of 0.0%), and Immigrants from Jordan (97.9%, a difference of 0.010%).
| Demographics | Rating | Rank | 1st Grade |
| Chileans | 55.6 /100 | #168 | Average 97.9% |
| Immigrants | Micronesia | 55.3 /100 | #169 | Average 97.9% |
| Immigrants | Spain | 54.9 /100 | #170 | Average 97.9% |
| Immigrants | Jordan | 53.9 /100 | #171 | Average 97.9% |
| Immigrants | Korea | 53.0 /100 | #172 | Average 97.9% |
| Kenyans | 51.2 /100 | #173 | Average 97.9% |
| Natives/Alaskans | 50.0 /100 | #174 | Average 97.9% |
| Immigrants | Sri Lanka | 49.7 /100 | #175 | Average 97.9% |
| Albanians | 49.6 /100 | #176 | Average 97.9% |
| Immigrants | Brazil | 49.1 /100 | #177 | Average 97.9% |
| Immigrants | Venezuela | 47.8 /100 | #178 | Average 97.9% |
| Argentineans | 47.2 /100 | #179 | Average 97.9% |
| Immigrants | Bosnia and Herzegovina | 46.6 /100 | #180 | Average 97.9% |
| Portuguese | 44.2 /100 | #181 | Average 97.9% |
| Egyptians | 42.7 /100 | #182 | Average 97.9% |