Bhutanese vs French Canadian Unemployment Among Seniors over 75 years
COMPARE
Bhutanese
French Canadian
Unemployment Among Seniors over 75 years
Unemployment Among Seniors over 75 years Comparison
Bhutanese
French Canadians
8.0%
UNEMPLOYMENT AMONG SENIORS OVER 75 YEARS
99.7/ 100
METRIC RATING
82nd/ 347
METRIC RANK
11.2%
UNEMPLOYMENT AMONG SENIORS OVER 75 YEARS
0.0/ 100
METRIC RATING
335th/ 347
METRIC RANK
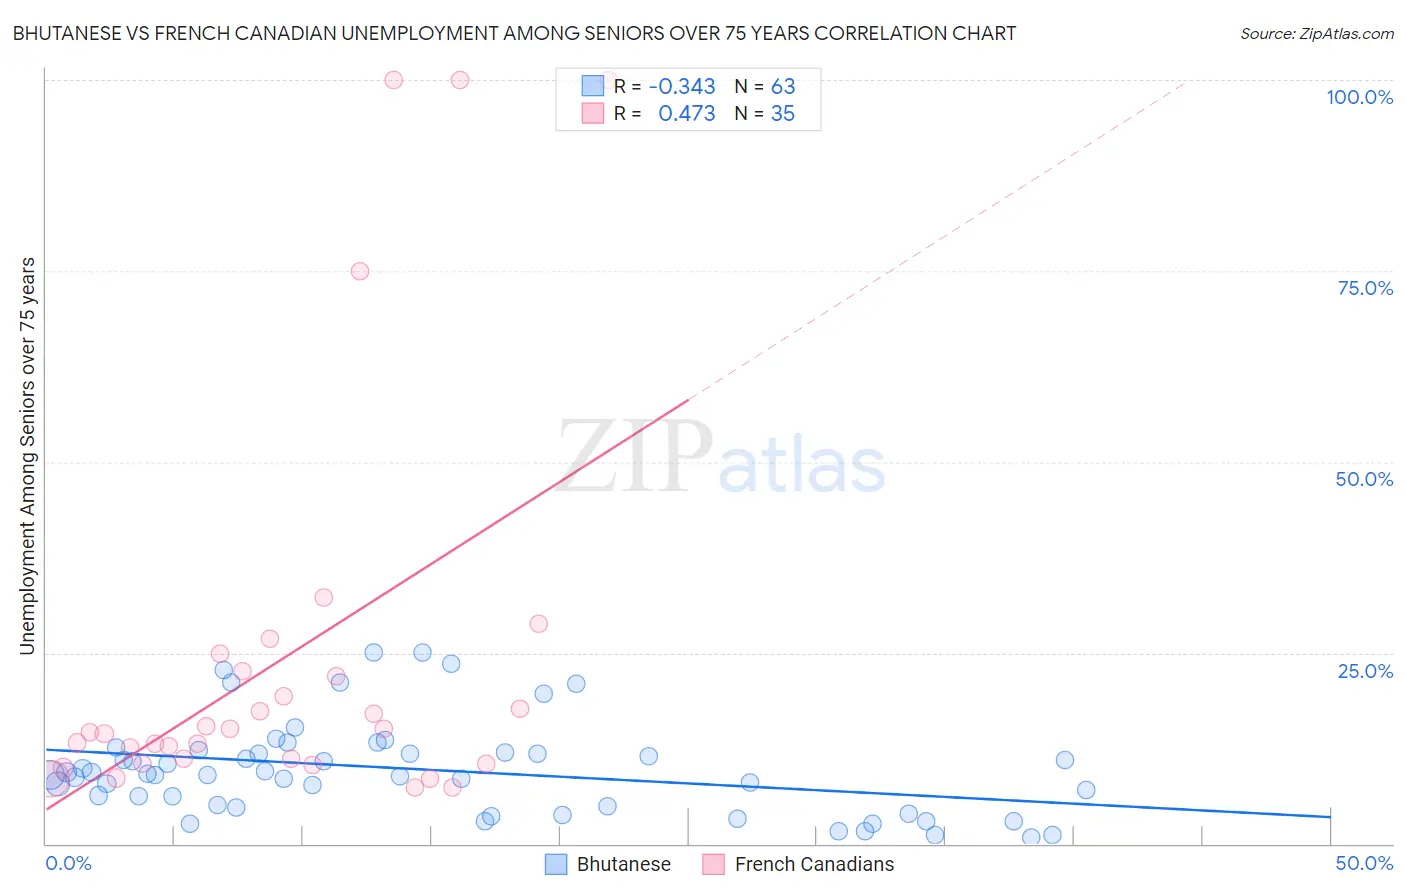
Bhutanese vs French Canadian Unemployment Among Seniors over 75 years Correlation Chart
The statistical analysis conducted on geographies consisting of 217,028,155 people shows a mild negative correlation between the proportion of Bhutanese and unemployment rate among seniors over the age of 75 in the United States with a correlation coefficient (R) of -0.343 and weighted average of 8.0%. Similarly, the statistical analysis conducted on geographies consisting of 223,817,634 people shows a moderate positive correlation between the proportion of French Canadians and unemployment rate among seniors over the age of 75 in the United States with a correlation coefficient (R) of 0.473 and weighted average of 11.2%, a difference of 38.9%.
Unemployment Among Seniors over 75 years Correlation Summary
| Measurement | Bhutanese | French Canadian |
| Minimum | 0.80% | 7.3% |
| Maximum | 25.0% | 100.0% |
| Range | 24.2% | 92.7% |
| Mean | 9.7% | 24.2% |
| Median | 9.1% | 14.6% |
| Interquartile 25% (IQ1) | 4.9% | 10.5% |
| Interquartile 75% (IQ3) | 11.9% | 22.6% |
| Interquartile Range (IQR) | 7.0% | 12.1% |
| Standard Deviation (Sample) | 6.1% | 26.3% |
| Standard Deviation (Population) | 6.1% | 25.9% |
Similar Demographics by Unemployment Among Seniors over 75 years
Demographics Similar to Bhutanese by Unemployment Among Seniors over 75 years
In terms of unemployment among seniors over 75 years, the demographic groups most similar to Bhutanese are Cuban (8.0%, a difference of 0.020%), Immigrants from Australia (8.0%, a difference of 0.030%), Immigrants from Japan (8.0%, a difference of 0.040%), Arapaho (8.1%, a difference of 0.11%), and U.S. Virgin Islander (8.1%, a difference of 0.19%).
| Demographics | Rating | Rank | Unemployment Among Seniors over 75 years |
| Immigrants | Uganda | 99.8 /100 | #75 | Exceptional 8.0% |
| Immigrants | Venezuela | 99.8 /100 | #76 | Exceptional 8.0% |
| Immigrants | Turkey | 99.8 /100 | #77 | Exceptional 8.0% |
| Immigrants | Belarus | 99.8 /100 | #78 | Exceptional 8.0% |
| Immigrants | Japan | 99.7 /100 | #79 | Exceptional 8.0% |
| Immigrants | Australia | 99.7 /100 | #80 | Exceptional 8.0% |
| Cubans | 99.7 /100 | #81 | Exceptional 8.0% |
| Bhutanese | 99.7 /100 | #82 | Exceptional 8.0% |
| Arapaho | 99.7 /100 | #83 | Exceptional 8.1% |
| U.S. Virgin Islanders | 99.7 /100 | #84 | Exceptional 8.1% |
| Immigrants | Indonesia | 99.7 /100 | #85 | Exceptional 8.1% |
| Immigrants | Singapore | 99.7 /100 | #86 | Exceptional 8.1% |
| Basques | 99.5 /100 | #87 | Exceptional 8.1% |
| New Zealanders | 99.5 /100 | #88 | Exceptional 8.1% |
| Immigrants | Korea | 99.5 /100 | #89 | Exceptional 8.1% |
Demographics Similar to French Canadians by Unemployment Among Seniors over 75 years
In terms of unemployment among seniors over 75 years, the demographic groups most similar to French Canadians are Assyrian/Chaldean/Syriac (11.1%, a difference of 1.1%), Immigrants from North Macedonia (11.3%, a difference of 1.2%), Alaskan Athabascan (11.0%, a difference of 1.5%), Cape Verdean (11.4%, a difference of 2.1%), and Immigrants from Liberia (10.9%, a difference of 2.7%).
| Demographics | Rating | Rank | Unemployment Among Seniors over 75 years |
| Immigrants | Portugal | 0.0 /100 | #328 | Tragic 10.5% |
| Tsimshian | 0.0 /100 | #329 | Tragic 10.5% |
| Immigrants | Azores | 0.0 /100 | #330 | Tragic 10.7% |
| Tohono O'odham | 0.0 /100 | #331 | Tragic 10.8% |
| Immigrants | Liberia | 0.0 /100 | #332 | Tragic 10.9% |
| Alaskan Athabascans | 0.0 /100 | #333 | Tragic 11.0% |
| Assyrians/Chaldeans/Syriacs | 0.0 /100 | #334 | Tragic 11.1% |
| French Canadians | 0.0 /100 | #335 | Tragic 11.2% |
| Immigrants | North Macedonia | 0.0 /100 | #336 | Tragic 11.3% |
| Cape Verdeans | 0.0 /100 | #337 | Tragic 11.4% |
| Immigrants | Cabo Verde | 0.0 /100 | #338 | Tragic 12.3% |
| Cajuns | 0.0 /100 | #339 | Tragic 12.5% |
| Yup'ik | 0.0 /100 | #340 | Tragic 12.8% |
| Lumbee | 0.0 /100 | #341 | Tragic 13.5% |
| Hmong | 0.0 /100 | #342 | Tragic 13.7% |