Immigrants from Czechoslovakia vs French Canadian Unemployment Among Seniors over 75 years
COMPARE
Immigrants from Czechoslovakia
French Canadian
Unemployment Among Seniors over 75 years
Unemployment Among Seniors over 75 years Comparison
Immigrants from Czechoslovakia
French Canadians
8.4%
UNEMPLOYMENT AMONG SENIORS OVER 75 YEARS
93.4/ 100
METRIC RATING
134th/ 347
METRIC RANK
11.2%
UNEMPLOYMENT AMONG SENIORS OVER 75 YEARS
0.0/ 100
METRIC RATING
335th/ 347
METRIC RANK
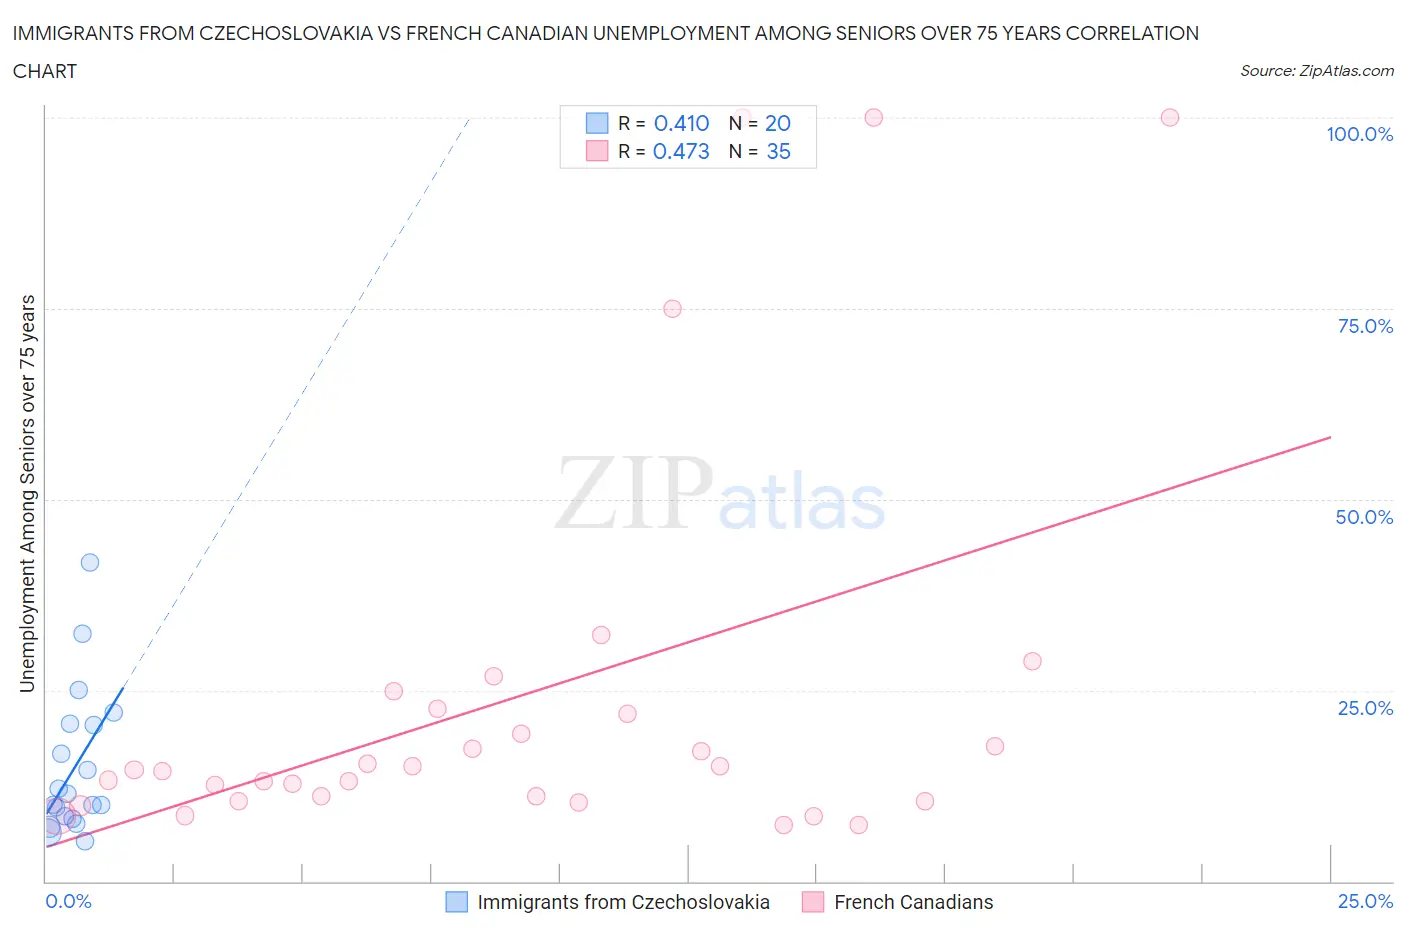
Immigrants from Czechoslovakia vs French Canadian Unemployment Among Seniors over 75 years Correlation Chart
The statistical analysis conducted on geographies consisting of 126,790,513 people shows a moderate positive correlation between the proportion of Immigrants from Czechoslovakia and unemployment rate among seniors over the age of 75 in the United States with a correlation coefficient (R) of 0.410 and weighted average of 8.4%. Similarly, the statistical analysis conducted on geographies consisting of 223,817,634 people shows a moderate positive correlation between the proportion of French Canadians and unemployment rate among seniors over the age of 75 in the United States with a correlation coefficient (R) of 0.473 and weighted average of 11.2%, a difference of 32.5%.
Unemployment Among Seniors over 75 years Correlation Summary
| Measurement | Immigrants from Czechoslovakia | French Canadian |
| Minimum | 5.2% | 7.3% |
| Maximum | 41.7% | 100.0% |
| Range | 36.6% | 92.7% |
| Mean | 15.0% | 24.2% |
| Median | 10.7% | 14.6% |
| Interquartile 25% (IQ1) | 8.4% | 10.5% |
| Interquartile 75% (IQ3) | 20.5% | 22.6% |
| Interquartile Range (IQR) | 12.2% | 12.1% |
| Standard Deviation (Sample) | 9.6% | 26.3% |
| Standard Deviation (Population) | 9.3% | 25.9% |
Similar Demographics by Unemployment Among Seniors over 75 years
Demographics Similar to Immigrants from Czechoslovakia by Unemployment Among Seniors over 75 years
In terms of unemployment among seniors over 75 years, the demographic groups most similar to Immigrants from Czechoslovakia are Serbian (8.4%, a difference of 0.080%), Chilean (8.4%, a difference of 0.11%), German Russian (8.4%, a difference of 0.39%), Haitian (8.5%, a difference of 0.39%), and Apache (8.4%, a difference of 0.48%).
| Demographics | Rating | Rank | Unemployment Among Seniors over 75 years |
| Hondurans | 96.2 /100 | #127 | Exceptional 8.4% |
| Native Hawaiians | 96.1 /100 | #128 | Exceptional 8.4% |
| Ghanaians | 96.0 /100 | #129 | Exceptional 8.4% |
| Apache | 95.2 /100 | #130 | Exceptional 8.4% |
| German Russians | 94.9 /100 | #131 | Exceptional 8.4% |
| Chileans | 93.8 /100 | #132 | Exceptional 8.4% |
| Serbians | 93.7 /100 | #133 | Exceptional 8.4% |
| Immigrants | Czechoslovakia | 93.4 /100 | #134 | Exceptional 8.4% |
| Haitians | 91.4 /100 | #135 | Exceptional 8.5% |
| Immigrants | Trinidad and Tobago | 90.8 /100 | #136 | Exceptional 8.5% |
| Immigrants | Kuwait | 90.5 /100 | #137 | Exceptional 8.5% |
| Immigrants | Bulgaria | 89.6 /100 | #138 | Excellent 8.5% |
| Barbadians | 88.6 /100 | #139 | Excellent 8.5% |
| South Americans | 87.9 /100 | #140 | Excellent 8.5% |
| Immigrants | Bolivia | 87.9 /100 | #141 | Excellent 8.5% |
Demographics Similar to French Canadians by Unemployment Among Seniors over 75 years
In terms of unemployment among seniors over 75 years, the demographic groups most similar to French Canadians are Assyrian/Chaldean/Syriac (11.1%, a difference of 1.1%), Immigrants from North Macedonia (11.3%, a difference of 1.2%), Alaskan Athabascan (11.0%, a difference of 1.5%), Cape Verdean (11.4%, a difference of 2.1%), and Immigrants from Liberia (10.9%, a difference of 2.7%).
| Demographics | Rating | Rank | Unemployment Among Seniors over 75 years |
| Immigrants | Portugal | 0.0 /100 | #328 | Tragic 10.5% |
| Tsimshian | 0.0 /100 | #329 | Tragic 10.5% |
| Immigrants | Azores | 0.0 /100 | #330 | Tragic 10.7% |
| Tohono O'odham | 0.0 /100 | #331 | Tragic 10.8% |
| Immigrants | Liberia | 0.0 /100 | #332 | Tragic 10.9% |
| Alaskan Athabascans | 0.0 /100 | #333 | Tragic 11.0% |
| Assyrians/Chaldeans/Syriacs | 0.0 /100 | #334 | Tragic 11.1% |
| French Canadians | 0.0 /100 | #335 | Tragic 11.2% |
| Immigrants | North Macedonia | 0.0 /100 | #336 | Tragic 11.3% |
| Cape Verdeans | 0.0 /100 | #337 | Tragic 11.4% |
| Immigrants | Cabo Verde | 0.0 /100 | #338 | Tragic 12.3% |
| Cajuns | 0.0 /100 | #339 | Tragic 12.5% |
| Yup'ik | 0.0 /100 | #340 | Tragic 12.8% |
| Lumbee | 0.0 /100 | #341 | Tragic 13.5% |
| Hmong | 0.0 /100 | #342 | Tragic 13.7% |