Bermudan vs Portuguese Unemployment Among Women with Children Under 6 years
COMPARE
Bermudan
Portuguese
Unemployment Among Women with Children Under 6 years
Unemployment Among Women with Children Under 6 years Comparison
Bermudans
Portuguese
8.7%
UNEMPLOYMENT AMONG WOMEN WITH CHILDREN UNDER 6 YEARS
0.0/ 100
METRIC RATING
282nd/ 347
METRIC RANK
8.0%
UNEMPLOYMENT AMONG WOMEN WITH CHILDREN UNDER 6 YEARS
6.2/ 100
METRIC RATING
227th/ 347
METRIC RANK
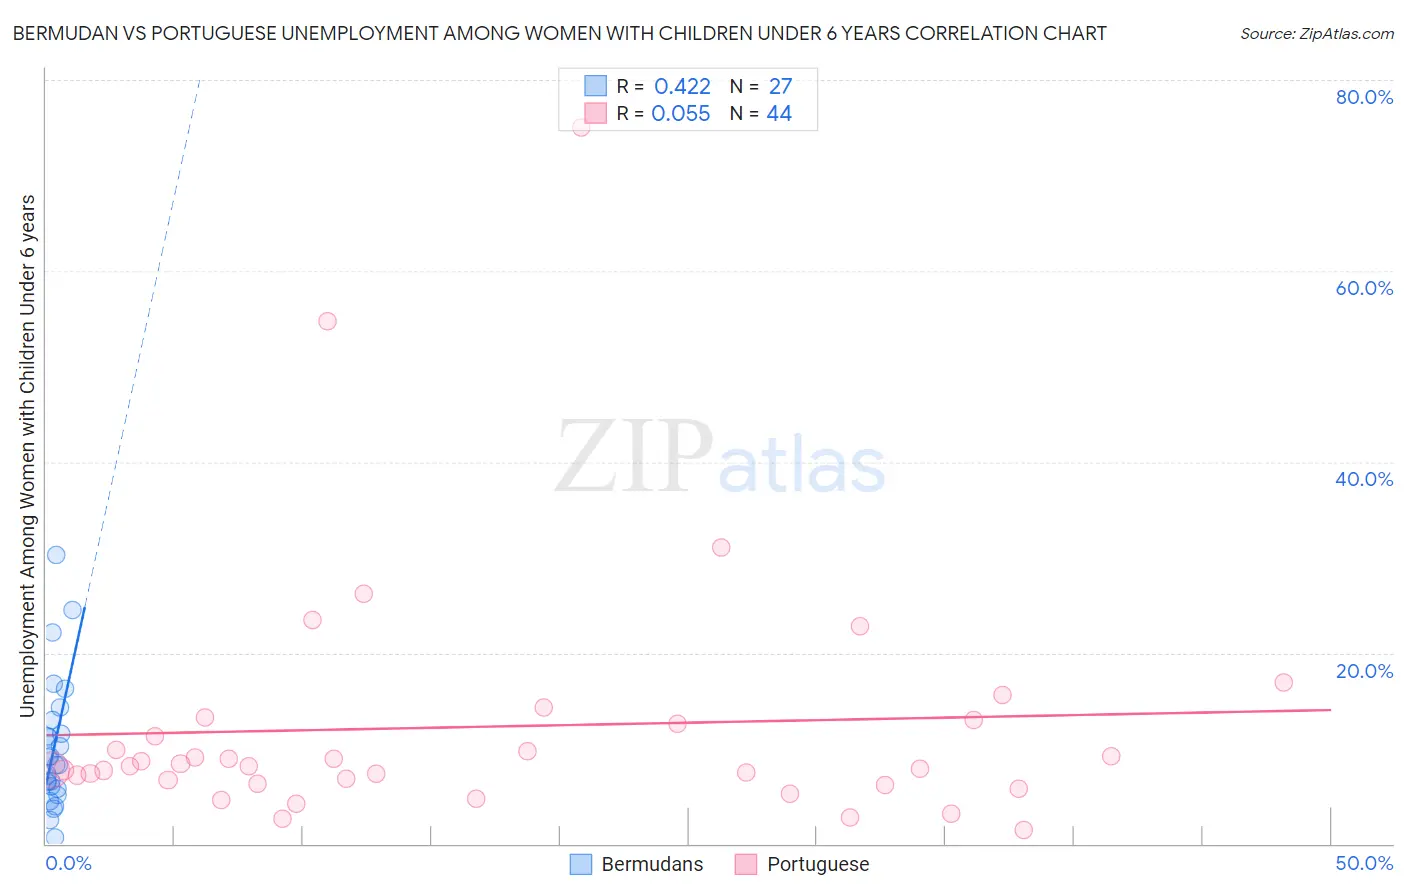
Bermudan vs Portuguese Unemployment Among Women with Children Under 6 years Correlation Chart
The statistical analysis conducted on geographies consisting of 52,533,202 people shows a moderate positive correlation between the proportion of Bermudans and unemployment rate among women with children under the age of 6 in the United States with a correlation coefficient (R) of 0.422 and weighted average of 8.7%. Similarly, the statistical analysis conducted on geographies consisting of 329,007,301 people shows a slight positive correlation between the proportion of Portuguese and unemployment rate among women with children under the age of 6 in the United States with a correlation coefficient (R) of 0.055 and weighted average of 8.0%, a difference of 8.5%.
Unemployment Among Women with Children Under 6 years Correlation Summary
| Measurement | Bermudan | Portuguese |
| Minimum | 0.60% | 1.4% |
| Maximum | 30.2% | 75.0% |
| Range | 29.6% | 73.6% |
| Mean | 10.2% | 12.3% |
| Median | 8.3% | 8.1% |
| Interquartile 25% (IQ1) | 5.8% | 6.5% |
| Interquartile 75% (IQ3) | 13.0% | 12.8% |
| Interquartile Range (IQR) | 7.2% | 6.3% |
| Standard Deviation (Sample) | 6.9% | 13.3% |
| Standard Deviation (Population) | 6.8% | 13.2% |
Similar Demographics by Unemployment Among Women with Children Under 6 years
Demographics Similar to Bermudans by Unemployment Among Women with Children Under 6 years
In terms of unemployment among women with children under 6 years, the demographic groups most similar to Bermudans are Spanish American Indian (8.7%, a difference of 0.020%), Guatemalan (8.7%, a difference of 0.090%), Blackfeet (8.7%, a difference of 0.18%), Immigrants from Belize (8.6%, a difference of 0.23%), and Immigrants from Dominica (8.6%, a difference of 0.27%).
| Demographics | Rating | Rank | Unemployment Among Women with Children Under 6 years |
| Immigrants | Latin America | 0.1 /100 | #275 | Tragic 8.6% |
| Yaqui | 0.0 /100 | #276 | Tragic 8.6% |
| Haitians | 0.0 /100 | #277 | Tragic 8.6% |
| Immigrants | Dominica | 0.0 /100 | #278 | Tragic 8.6% |
| Immigrants | Guatemala | 0.0 /100 | #279 | Tragic 8.6% |
| Immigrants | Belize | 0.0 /100 | #280 | Tragic 8.6% |
| Guatemalans | 0.0 /100 | #281 | Tragic 8.7% |
| Bermudans | 0.0 /100 | #282 | Tragic 8.7% |
| Spanish American Indians | 0.0 /100 | #283 | Tragic 8.7% |
| Blackfeet | 0.0 /100 | #284 | Tragic 8.7% |
| U.S. Virgin Islanders | 0.0 /100 | #285 | Tragic 8.7% |
| Seminole | 0.0 /100 | #286 | Tragic 8.7% |
| Menominee | 0.0 /100 | #287 | Tragic 8.7% |
| Bahamians | 0.0 /100 | #288 | Tragic 8.7% |
| Iroquois | 0.0 /100 | #289 | Tragic 8.7% |
Demographics Similar to Portuguese by Unemployment Among Women with Children Under 6 years
In terms of unemployment among women with children under 6 years, the demographic groups most similar to Portuguese are Senegalese (8.0%, a difference of 0.010%), Immigrants from Sudan (8.0%, a difference of 0.030%), Salvadoran (8.0%, a difference of 0.18%), German (8.0%, a difference of 0.22%), and Finnish (8.0%, a difference of 0.25%).
| Demographics | Rating | Rank | Unemployment Among Women with Children Under 6 years |
| South American Indians | 9.3 /100 | #220 | Tragic 7.9% |
| Immigrants | Germany | 8.5 /100 | #221 | Tragic 7.9% |
| Samoans | 8.4 /100 | #222 | Tragic 7.9% |
| Carpatho Rusyns | 7.8 /100 | #223 | Tragic 8.0% |
| English | 7.2 /100 | #224 | Tragic 8.0% |
| Germans | 7.0 /100 | #225 | Tragic 8.0% |
| Senegalese | 6.2 /100 | #226 | Tragic 8.0% |
| Portuguese | 6.2 /100 | #227 | Tragic 8.0% |
| Immigrants | Sudan | 6.0 /100 | #228 | Tragic 8.0% |
| Salvadorans | 5.5 /100 | #229 | Tragic 8.0% |
| Finns | 5.3 /100 | #230 | Tragic 8.0% |
| Trinidadians and Tobagonians | 5.3 /100 | #231 | Tragic 8.0% |
| Welsh | 5.0 /100 | #232 | Tragic 8.0% |
| Immigrants | Trinidad and Tobago | 4.8 /100 | #233 | Tragic 8.0% |
| Kiowa | 4.4 /100 | #234 | Tragic 8.0% |