Immigrants from Latvia vs Portuguese Unemployment Among Women with Children Under 6 years
COMPARE
Immigrants from Latvia
Portuguese
Unemployment Among Women with Children Under 6 years
Unemployment Among Women with Children Under 6 years Comparison
Immigrants from Latvia
Portuguese
6.8%
UNEMPLOYMENT AMONG WOMEN WITH CHILDREN UNDER 6 YEARS
99.9/ 100
METRIC RATING
54th/ 347
METRIC RANK
8.0%
UNEMPLOYMENT AMONG WOMEN WITH CHILDREN UNDER 6 YEARS
6.2/ 100
METRIC RATING
227th/ 347
METRIC RANK
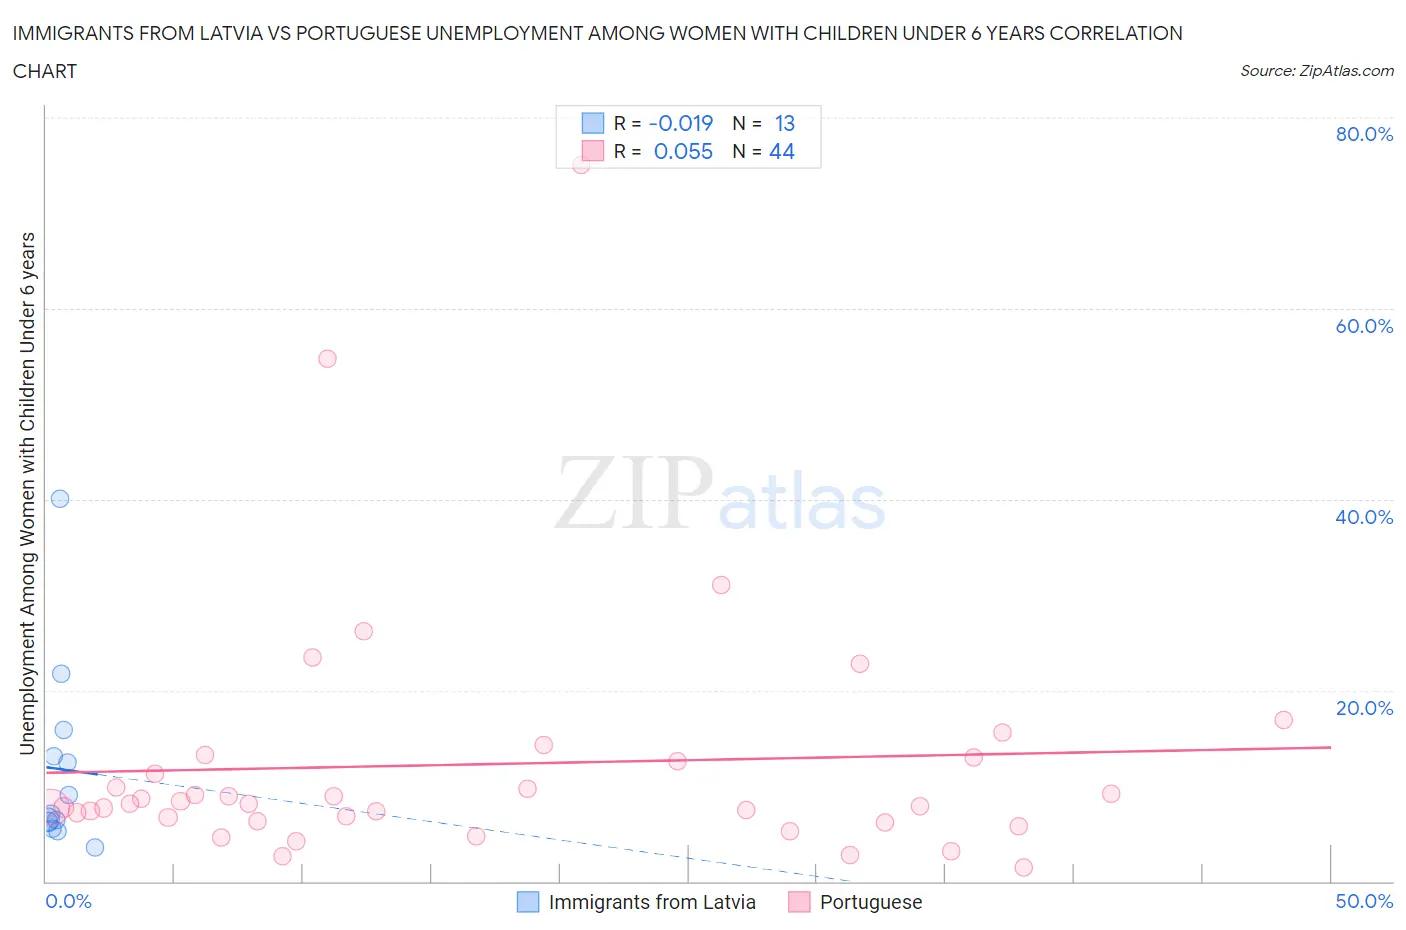
Immigrants from Latvia vs Portuguese Unemployment Among Women with Children Under 6 years Correlation Chart
The statistical analysis conducted on geographies consisting of 99,406,328 people shows no correlation between the proportion of Immigrants from Latvia and unemployment rate among women with children under the age of 6 in the United States with a correlation coefficient (R) of -0.019 and weighted average of 6.8%. Similarly, the statistical analysis conducted on geographies consisting of 329,007,301 people shows a slight positive correlation between the proportion of Portuguese and unemployment rate among women with children under the age of 6 in the United States with a correlation coefficient (R) of 0.055 and weighted average of 8.0%, a difference of 17.3%.
Unemployment Among Women with Children Under 6 years Correlation Summary
| Measurement | Immigrants from Latvia | Portuguese |
| Minimum | 3.6% | 1.4% |
| Maximum | 40.1% | 75.0% |
| Range | 36.5% | 73.6% |
| Mean | 11.7% | 12.3% |
| Median | 7.1% | 8.1% |
| Interquartile 25% (IQ1) | 5.9% | 6.5% |
| Interquartile 75% (IQ3) | 14.4% | 12.8% |
| Interquartile Range (IQR) | 8.5% | 6.3% |
| Standard Deviation (Sample) | 9.9% | 13.3% |
| Standard Deviation (Population) | 9.6% | 13.2% |
Similar Demographics by Unemployment Among Women with Children Under 6 years
Demographics Similar to Immigrants from Latvia by Unemployment Among Women with Children Under 6 years
In terms of unemployment among women with children under 6 years, the demographic groups most similar to Immigrants from Latvia are Chinese (6.8%, a difference of 0.17%), Immigrants from Iran (6.8%, a difference of 0.25%), Ethiopian (6.8%, a difference of 0.36%), Immigrants from Ireland (6.8%, a difference of 0.38%), and Immigrants from Nepal (6.8%, a difference of 0.39%).
| Demographics | Rating | Rank | Unemployment Among Women with Children Under 6 years |
| Immigrants | Asia | 99.9 /100 | #47 | Exceptional 6.8% |
| Immigrants | Switzerland | 99.9 /100 | #48 | Exceptional 6.8% |
| Immigrants | Nepal | 99.9 /100 | #49 | Exceptional 6.8% |
| Immigrants | Ireland | 99.9 /100 | #50 | Exceptional 6.8% |
| Ethiopians | 99.9 /100 | #51 | Exceptional 6.8% |
| Immigrants | Iran | 99.9 /100 | #52 | Exceptional 6.8% |
| Chinese | 99.9 /100 | #53 | Exceptional 6.8% |
| Immigrants | Latvia | 99.9 /100 | #54 | Exceptional 6.8% |
| Immigrants | Ukraine | 99.8 /100 | #55 | Exceptional 6.8% |
| Immigrants | Ethiopia | 99.8 /100 | #56 | Exceptional 6.9% |
| Icelanders | 99.8 /100 | #57 | Exceptional 6.9% |
| Immigrants | Turkey | 99.8 /100 | #58 | Exceptional 6.9% |
| Immigrants | Serbia | 99.8 /100 | #59 | Exceptional 6.9% |
| Immigrants | Sri Lanka | 99.8 /100 | #60 | Exceptional 6.9% |
| Immigrants | France | 99.7 /100 | #61 | Exceptional 6.9% |
Demographics Similar to Portuguese by Unemployment Among Women with Children Under 6 years
In terms of unemployment among women with children under 6 years, the demographic groups most similar to Portuguese are Senegalese (8.0%, a difference of 0.010%), Immigrants from Sudan (8.0%, a difference of 0.030%), Salvadoran (8.0%, a difference of 0.18%), German (8.0%, a difference of 0.22%), and Finnish (8.0%, a difference of 0.25%).
| Demographics | Rating | Rank | Unemployment Among Women with Children Under 6 years |
| South American Indians | 9.3 /100 | #220 | Tragic 7.9% |
| Immigrants | Germany | 8.5 /100 | #221 | Tragic 7.9% |
| Samoans | 8.4 /100 | #222 | Tragic 7.9% |
| Carpatho Rusyns | 7.8 /100 | #223 | Tragic 8.0% |
| English | 7.2 /100 | #224 | Tragic 8.0% |
| Germans | 7.0 /100 | #225 | Tragic 8.0% |
| Senegalese | 6.2 /100 | #226 | Tragic 8.0% |
| Portuguese | 6.2 /100 | #227 | Tragic 8.0% |
| Immigrants | Sudan | 6.0 /100 | #228 | Tragic 8.0% |
| Salvadorans | 5.5 /100 | #229 | Tragic 8.0% |
| Finns | 5.3 /100 | #230 | Tragic 8.0% |
| Trinidadians and Tobagonians | 5.3 /100 | #231 | Tragic 8.0% |
| Welsh | 5.0 /100 | #232 | Tragic 8.0% |
| Immigrants | Trinidad and Tobago | 4.8 /100 | #233 | Tragic 8.0% |
| Kiowa | 4.4 /100 | #234 | Tragic 8.0% |