Barbadian vs Immigrants from Somalia Unemployment Among Ages 55 to 59 years
COMPARE
Barbadian
Immigrants from Somalia
Unemployment Among Ages 55 to 59 years
Unemployment Among Ages 55 to 59 years Comparison
Barbadians
Immigrants from Somalia
5.3%
UNEMPLOYMENT AMONG AGES 55 TO 59 YEARS
0.0/ 100
METRIC RATING
296th/ 347
METRIC RANK
4.4%
UNEMPLOYMENT AMONG AGES 55 TO 59 YEARS
100.0/ 100
METRIC RATING
18th/ 347
METRIC RANK
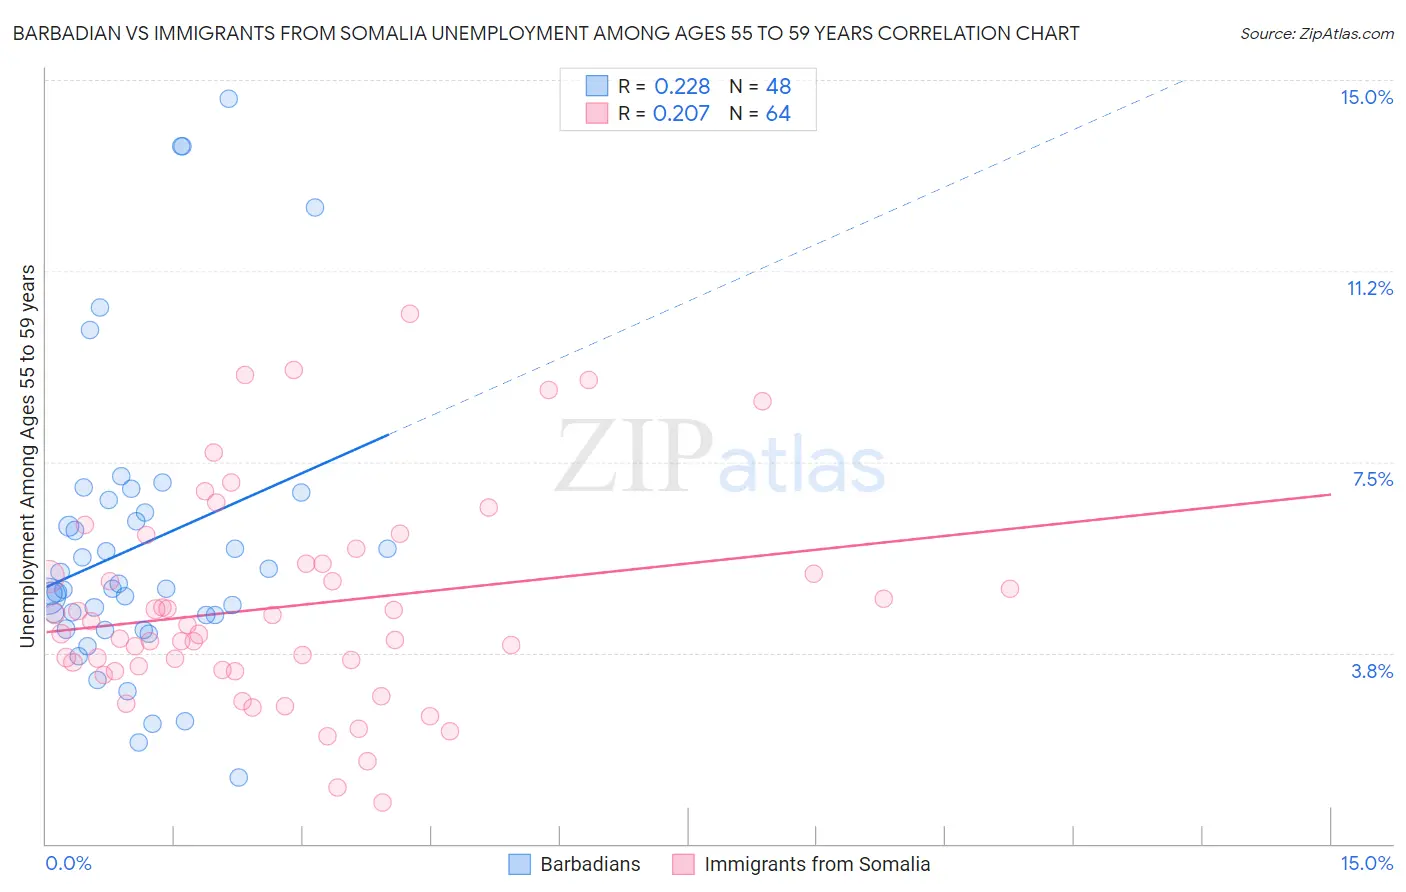
Barbadian vs Immigrants from Somalia Unemployment Among Ages 55 to 59 years Correlation Chart
The statistical analysis conducted on geographies consisting of 137,668,651 people shows a weak positive correlation between the proportion of Barbadians and unemployment rate among population between the ages 55 and 59 in the United States with a correlation coefficient (R) of 0.228 and weighted average of 5.3%. Similarly, the statistical analysis conducted on geographies consisting of 90,227,200 people shows a weak positive correlation between the proportion of Immigrants from Somalia and unemployment rate among population between the ages 55 and 59 in the United States with a correlation coefficient (R) of 0.207 and weighted average of 4.4%, a difference of 21.2%.
Unemployment Among Ages 55 to 59 years Correlation Summary
| Measurement | Barbadian | Immigrants from Somalia |
| Minimum | 1.3% | 0.80% |
| Maximum | 14.6% | 10.4% |
| Range | 13.3% | 9.6% |
| Mean | 5.9% | 4.7% |
| Median | 5.0% | 4.2% |
| Interquartile 25% (IQ1) | 4.4% | 3.4% |
| Interquartile 75% (IQ3) | 6.6% | 5.5% |
| Interquartile Range (IQR) | 2.3% | 2.1% |
| Standard Deviation (Sample) | 2.9% | 2.0% |
| Standard Deviation (Population) | 2.9% | 2.0% |
Similar Demographics by Unemployment Among Ages 55 to 59 years
Demographics Similar to Barbadians by Unemployment Among Ages 55 to 59 years
In terms of unemployment among ages 55 to 59 years, the demographic groups most similar to Barbadians are Dutch West Indian (5.3%, a difference of 0.040%), Cajun (5.3%, a difference of 0.16%), Immigrants from Mexico (5.3%, a difference of 0.22%), Immigrants from Grenada (5.3%, a difference of 0.28%), and British West Indian (5.3%, a difference of 0.47%).
| Demographics | Rating | Rank | Unemployment Among Ages 55 to 59 years |
| Immigrants | Central America | 0.0 /100 | #289 | Tragic 5.3% |
| Sioux | 0.0 /100 | #290 | Tragic 5.3% |
| Trinidadians and Tobagonians | 0.0 /100 | #291 | Tragic 5.3% |
| British West Indians | 0.0 /100 | #292 | Tragic 5.3% |
| Immigrants | Grenada | 0.0 /100 | #293 | Tragic 5.3% |
| Cajuns | 0.0 /100 | #294 | Tragic 5.3% |
| Dutch West Indians | 0.0 /100 | #295 | Tragic 5.3% |
| Barbadians | 0.0 /100 | #296 | Tragic 5.3% |
| Immigrants | Mexico | 0.0 /100 | #297 | Tragic 5.3% |
| Hispanics or Latinos | 0.0 /100 | #298 | Tragic 5.4% |
| Cape Verdeans | 0.0 /100 | #299 | Tragic 5.4% |
| Immigrants | St. Vincent and the Grenadines | 0.0 /100 | #300 | Tragic 5.4% |
| Immigrants | Dominica | 0.0 /100 | #301 | Tragic 5.5% |
| Sierra Leoneans | 0.0 /100 | #302 | Tragic 5.5% |
| Marshallese | 0.0 /100 | #303 | Tragic 5.5% |
Demographics Similar to Immigrants from Somalia by Unemployment Among Ages 55 to 59 years
In terms of unemployment among ages 55 to 59 years, the demographic groups most similar to Immigrants from Somalia are Chinese (4.4%, a difference of 0.090%), Swedish (4.4%, a difference of 0.22%), Puget Sound Salish (4.4%, a difference of 0.37%), Immigrants from Burma/Myanmar (4.4%, a difference of 0.46%), and Kenyan (4.4%, a difference of 0.72%).
| Demographics | Rating | Rank | Unemployment Among Ages 55 to 59 years |
| Immigrants | Congo | 100.0 /100 | #11 | Exceptional 4.3% |
| Danes | 100.0 /100 | #12 | Exceptional 4.3% |
| Indonesians | 100.0 /100 | #13 | Exceptional 4.3% |
| Immigrants | India | 100.0 /100 | #14 | Exceptional 4.3% |
| Bulgarians | 100.0 /100 | #15 | Exceptional 4.3% |
| Somalis | 100.0 /100 | #16 | Exceptional 4.4% |
| Czechs | 100.0 /100 | #17 | Exceptional 4.4% |
| Immigrants | Somalia | 100.0 /100 | #18 | Exceptional 4.4% |
| Chinese | 100.0 /100 | #19 | Exceptional 4.4% |
| Swedes | 100.0 /100 | #20 | Exceptional 4.4% |
| Puget Sound Salish | 100.0 /100 | #21 | Exceptional 4.4% |
| Immigrants | Burma/Myanmar | 100.0 /100 | #22 | Exceptional 4.4% |
| Kenyans | 100.0 /100 | #23 | Exceptional 4.4% |
| Jordanians | 100.0 /100 | #24 | Exceptional 4.4% |
| Immigrants | Eritrea | 100.0 /100 | #25 | Exceptional 4.4% |