Senegalese vs Immigrants from Somalia Unemployment Among Ages 55 to 59 years
COMPARE
Senegalese
Immigrants from Somalia
Unemployment Among Ages 55 to 59 years
Unemployment Among Ages 55 to 59 years Comparison
Senegalese
Immigrants from Somalia
5.1%
UNEMPLOYMENT AMONG AGES 55 TO 59 YEARS
0.3/ 100
METRIC RATING
256th/ 347
METRIC RANK
4.4%
UNEMPLOYMENT AMONG AGES 55 TO 59 YEARS
100.0/ 100
METRIC RATING
18th/ 347
METRIC RANK
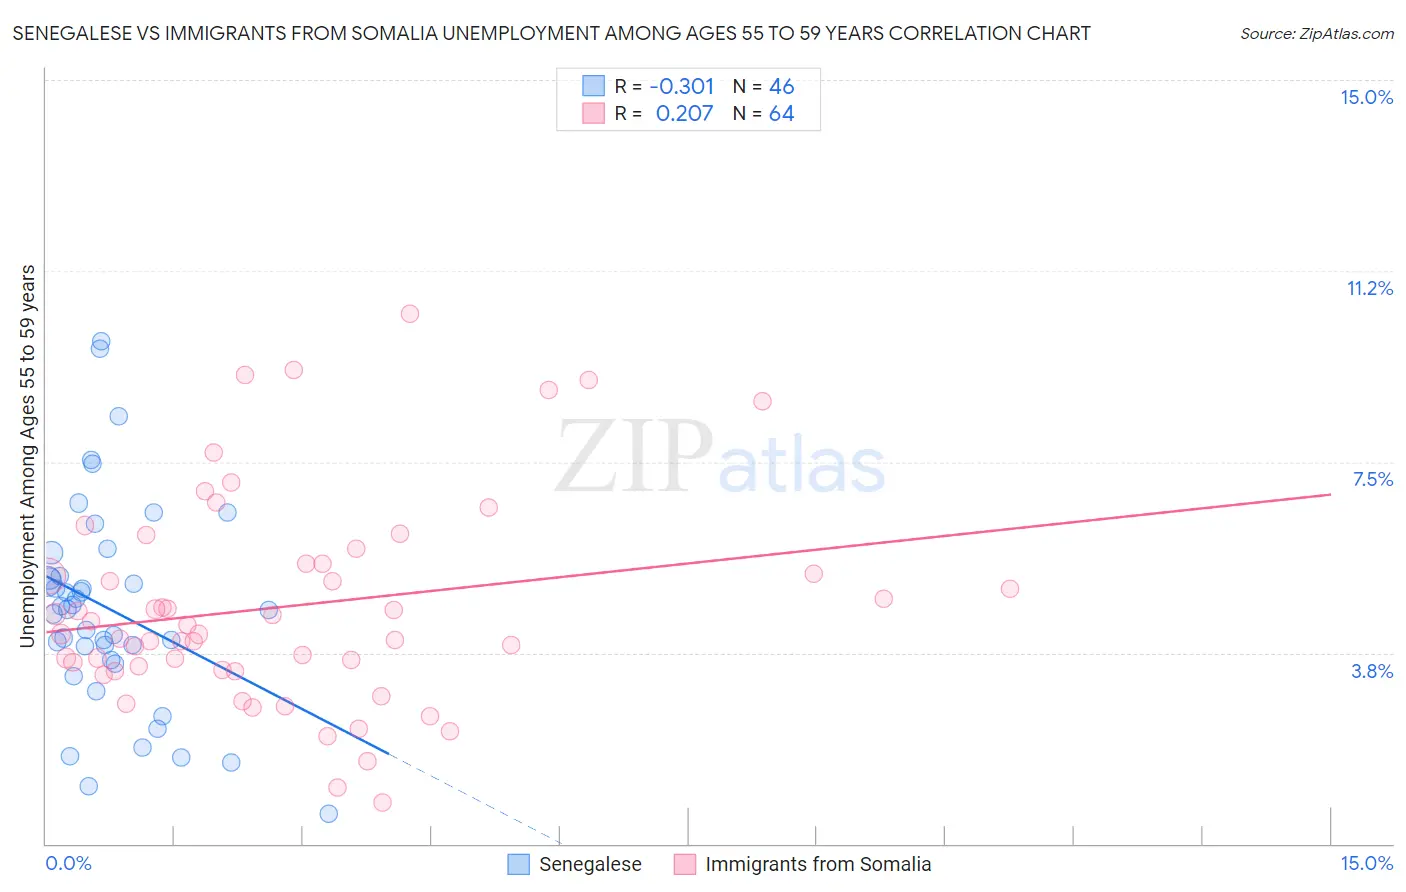
Senegalese vs Immigrants from Somalia Unemployment Among Ages 55 to 59 years Correlation Chart
The statistical analysis conducted on geographies consisting of 76,756,988 people shows a mild negative correlation between the proportion of Senegalese and unemployment rate among population between the ages 55 and 59 in the United States with a correlation coefficient (R) of -0.301 and weighted average of 5.1%. Similarly, the statistical analysis conducted on geographies consisting of 90,227,200 people shows a weak positive correlation between the proportion of Immigrants from Somalia and unemployment rate among population between the ages 55 and 59 in the United States with a correlation coefficient (R) of 0.207 and weighted average of 4.4%, a difference of 16.2%.
Unemployment Among Ages 55 to 59 years Correlation Summary
| Measurement | Senegalese | Immigrants from Somalia |
| Minimum | 0.60% | 0.80% |
| Maximum | 9.9% | 10.4% |
| Range | 9.3% | 9.6% |
| Mean | 4.6% | 4.7% |
| Median | 4.6% | 4.2% |
| Interquartile 25% (IQ1) | 3.6% | 3.4% |
| Interquartile 75% (IQ3) | 5.3% | 5.5% |
| Interquartile Range (IQR) | 1.6% | 2.1% |
| Standard Deviation (Sample) | 2.0% | 2.0% |
| Standard Deviation (Population) | 2.0% | 2.0% |
Similar Demographics by Unemployment Among Ages 55 to 59 years
Demographics Similar to Senegalese by Unemployment Among Ages 55 to 59 years
In terms of unemployment among ages 55 to 59 years, the demographic groups most similar to Senegalese are Blackfeet (5.1%, a difference of 0.11%), Seminole (5.1%, a difference of 0.18%), Paraguayan (5.1%, a difference of 0.21%), U.S. Virgin Islander (5.1%, a difference of 0.25%), and Portuguese (5.1%, a difference of 0.27%).
| Demographics | Rating | Rank | Unemployment Among Ages 55 to 59 years |
| Comanche | 0.4 /100 | #249 | Tragic 5.1% |
| Cheyenne | 0.4 /100 | #250 | Tragic 5.1% |
| Portuguese | 0.3 /100 | #251 | Tragic 5.1% |
| U.S. Virgin Islanders | 0.3 /100 | #252 | Tragic 5.1% |
| Paraguayans | 0.3 /100 | #253 | Tragic 5.1% |
| Seminole | 0.3 /100 | #254 | Tragic 5.1% |
| Blackfeet | 0.3 /100 | #255 | Tragic 5.1% |
| Senegalese | 0.3 /100 | #256 | Tragic 5.1% |
| Central Americans | 0.2 /100 | #257 | Tragic 5.1% |
| Salvadorans | 0.2 /100 | #258 | Tragic 5.1% |
| Immigrants | West Indies | 0.2 /100 | #259 | Tragic 5.1% |
| Immigrants | Western Africa | 0.2 /100 | #260 | Tragic 5.1% |
| Africans | 0.1 /100 | #261 | Tragic 5.1% |
| Immigrants | El Salvador | 0.1 /100 | #262 | Tragic 5.1% |
| Immigrants | Sierra Leone | 0.1 /100 | #263 | Tragic 5.2% |
Demographics Similar to Immigrants from Somalia by Unemployment Among Ages 55 to 59 years
In terms of unemployment among ages 55 to 59 years, the demographic groups most similar to Immigrants from Somalia are Chinese (4.4%, a difference of 0.090%), Swedish (4.4%, a difference of 0.22%), Puget Sound Salish (4.4%, a difference of 0.37%), Immigrants from Burma/Myanmar (4.4%, a difference of 0.46%), and Kenyan (4.4%, a difference of 0.72%).
| Demographics | Rating | Rank | Unemployment Among Ages 55 to 59 years |
| Immigrants | Congo | 100.0 /100 | #11 | Exceptional 4.3% |
| Danes | 100.0 /100 | #12 | Exceptional 4.3% |
| Indonesians | 100.0 /100 | #13 | Exceptional 4.3% |
| Immigrants | India | 100.0 /100 | #14 | Exceptional 4.3% |
| Bulgarians | 100.0 /100 | #15 | Exceptional 4.3% |
| Somalis | 100.0 /100 | #16 | Exceptional 4.4% |
| Czechs | 100.0 /100 | #17 | Exceptional 4.4% |
| Immigrants | Somalia | 100.0 /100 | #18 | Exceptional 4.4% |
| Chinese | 100.0 /100 | #19 | Exceptional 4.4% |
| Swedes | 100.0 /100 | #20 | Exceptional 4.4% |
| Puget Sound Salish | 100.0 /100 | #21 | Exceptional 4.4% |
| Immigrants | Burma/Myanmar | 100.0 /100 | #22 | Exceptional 4.4% |
| Kenyans | 100.0 /100 | #23 | Exceptional 4.4% |
| Jordanians | 100.0 /100 | #24 | Exceptional 4.4% |
| Immigrants | Eritrea | 100.0 /100 | #25 | Exceptional 4.4% |