Immigrants from Saudi Arabia vs Dutch Unemployment Among Ages 20 to 24 years
COMPARE
Immigrants from Saudi Arabia
Dutch
Unemployment Among Ages 20 to 24 years
Unemployment Among Ages 20 to 24 years Comparison
Immigrants from Saudi Arabia
Dutch
9.7%
UNEMPLOYMENT AMONG AGES 20 TO 24 YEARS
99.9/ 100
METRIC RATING
42nd/ 347
METRIC RANK
9.6%
UNEMPLOYMENT AMONG AGES 20 TO 24 YEARS
99.9/ 100
METRIC RATING
39th/ 347
METRIC RANK
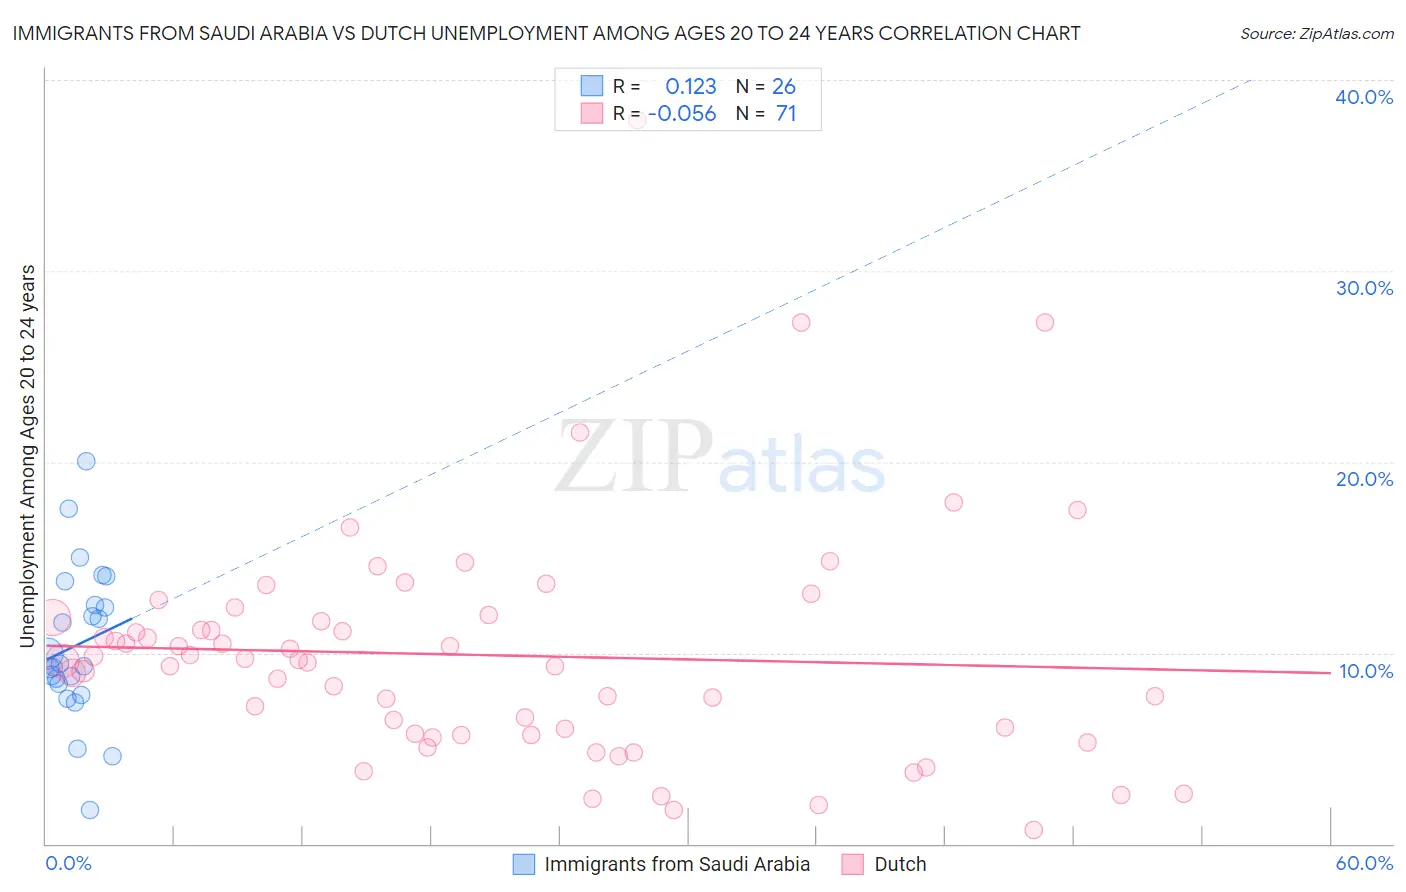
Immigrants from Saudi Arabia vs Dutch Unemployment Among Ages 20 to 24 years Correlation Chart
The statistical analysis conducted on geographies consisting of 163,142,127 people shows a poor positive correlation between the proportion of Immigrants from Saudi Arabia and unemployment rate among population between the ages 20 and 24 in the United States with a correlation coefficient (R) of 0.123 and weighted average of 9.7%. Similarly, the statistical analysis conducted on geographies consisting of 510,210,061 people shows a slight negative correlation between the proportion of Dutch and unemployment rate among population between the ages 20 and 24 in the United States with a correlation coefficient (R) of -0.056 and weighted average of 9.6%, a difference of 0.63%.
Unemployment Among Ages 20 to 24 years Correlation Summary
| Measurement | Immigrants from Saudi Arabia | Dutch |
| Minimum | 1.8% | 0.70% |
| Maximum | 20.1% | 37.9% |
| Range | 18.3% | 37.2% |
| Mean | 10.4% | 9.9% |
| Median | 9.4% | 9.6% |
| Interquartile 25% (IQ1) | 8.4% | 5.7% |
| Interquartile 75% (IQ3) | 12.5% | 11.9% |
| Interquartile Range (IQR) | 4.1% | 6.2% |
| Standard Deviation (Sample) | 4.0% | 6.2% |
| Standard Deviation (Population) | 3.9% | 6.1% |
Demographics Similar to Immigrants from Saudi Arabia and Dutch by Unemployment Among Ages 20 to 24 years
In terms of unemployment among ages 20 to 24 years, the demographic groups most similar to Immigrants from Saudi Arabia are Swiss (9.7%, a difference of 0.080%), Menominee (9.7%, a difference of 0.16%), European (9.7%, a difference of 0.29%), Croatian (9.7%, a difference of 0.34%), and Immigrants from Nicaragua (9.7%, a difference of 0.36%). Similarly, the demographic groups most similar to Dutch are Immigrants from Ethiopia (9.6%, a difference of 0.040%), Afghan (9.6%, a difference of 0.22%), Immigrants from Zaire (9.6%, a difference of 0.29%), Belgian (9.6%, a difference of 0.37%), and German (9.6%, a difference of 0.40%).
| Demographics | Rating | Rank | Unemployment Among Ages 20 to 24 years |
| Scandinavians | 100.0 /100 | #30 | Exceptional 9.5% |
| Immigrants | Eastern Africa | 100.0 /100 | #31 | Exceptional 9.5% |
| Cambodians | 100.0 /100 | #32 | Exceptional 9.5% |
| Australians | 100.0 /100 | #33 | Exceptional 9.6% |
| Yugoslavians | 100.0 /100 | #34 | Exceptional 9.6% |
| Germans | 100.0 /100 | #35 | Exceptional 9.6% |
| Belgians | 100.0 /100 | #36 | Exceptional 9.6% |
| Immigrants | Zaire | 100.0 /100 | #37 | Exceptional 9.6% |
| Afghans | 99.9 /100 | #38 | Exceptional 9.6% |
| Dutch | 99.9 /100 | #39 | Exceptional 9.6% |
| Immigrants | Ethiopia | 99.9 /100 | #40 | Exceptional 9.6% |
| Swiss | 99.9 /100 | #41 | Exceptional 9.7% |
| Immigrants | Saudi Arabia | 99.9 /100 | #42 | Exceptional 9.7% |
| Menominee | 99.8 /100 | #43 | Exceptional 9.7% |
| Europeans | 99.8 /100 | #44 | Exceptional 9.7% |
| Croatians | 99.8 /100 | #45 | Exceptional 9.7% |
| Immigrants | Nicaragua | 99.8 /100 | #46 | Exceptional 9.7% |
| Immigrants | India | 99.8 /100 | #47 | Exceptional 9.7% |
| Finns | 99.8 /100 | #48 | Exceptional 9.7% |
| Creek | 99.8 /100 | #49 | Exceptional 9.7% |
| Immigrants | Kenya | 99.7 /100 | #50 | Exceptional 9.7% |