Bangladeshi vs Danish Unemployment Among Women with Children Under 6 years
COMPARE
Bangladeshi
Danish
Unemployment Among Women with Children Under 6 years
Unemployment Among Women with Children Under 6 years Comparison
Bangladeshis
Danes
7.5%
UNEMPLOYMENT AMONG WOMEN WITH CHILDREN UNDER 6 YEARS
74.8/ 100
METRIC RATING
152nd/ 347
METRIC RANK
7.1%
UNEMPLOYMENT AMONG WOMEN WITH CHILDREN UNDER 6 YEARS
98.2/ 100
METRIC RATING
91st/ 347
METRIC RANK
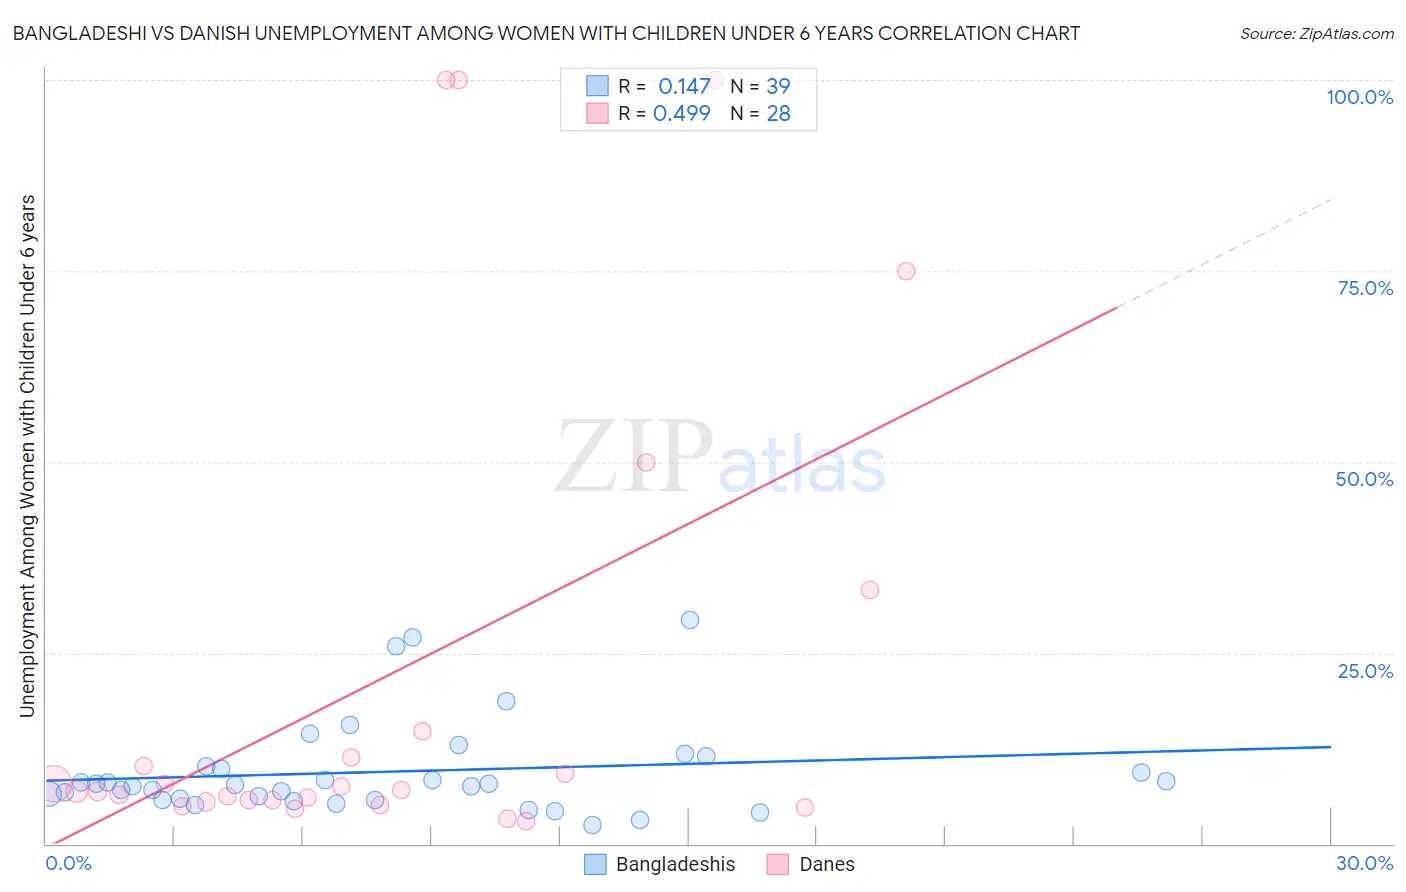
Bangladeshi vs Danish Unemployment Among Women with Children Under 6 years Correlation Chart
The statistical analysis conducted on geographies consisting of 122,945,375 people shows a poor positive correlation between the proportion of Bangladeshis and unemployment rate among women with children under the age of 6 in the United States with a correlation coefficient (R) of 0.147 and weighted average of 7.5%. Similarly, the statistical analysis conducted on geographies consisting of 332,454,296 people shows a moderate positive correlation between the proportion of Danes and unemployment rate among women with children under the age of 6 in the United States with a correlation coefficient (R) of 0.499 and weighted average of 7.1%, a difference of 5.1%.
Unemployment Among Women with Children Under 6 years Correlation Summary
| Measurement | Bangladeshi | Danish |
| Minimum | 2.5% | 3.0% |
| Maximum | 29.3% | 100.0% |
| Range | 26.8% | 97.0% |
| Mean | 9.4% | 21.7% |
| Median | 7.7% | 6.9% |
| Interquartile 25% (IQ1) | 5.7% | 5.6% |
| Interquartile 75% (IQ3) | 10.1% | 13.0% |
| Interquartile Range (IQR) | 4.4% | 7.4% |
| Standard Deviation (Sample) | 6.2% | 31.7% |
| Standard Deviation (Population) | 6.1% | 31.2% |
Similar Demographics by Unemployment Among Women with Children Under 6 years
Demographics Similar to Bangladeshis by Unemployment Among Women with Children Under 6 years
In terms of unemployment among women with children under 6 years, the demographic groups most similar to Bangladeshis are Immigrants from Peru (7.5%, a difference of 0.010%), Uruguayan (7.5%, a difference of 0.010%), Northern European (7.5%, a difference of 0.040%), South American (7.5%, a difference of 0.060%), and Colombian (7.5%, a difference of 0.11%).
| Demographics | Rating | Rank | Unemployment Among Women with Children Under 6 years |
| Immigrants | Jordan | 78.9 /100 | #145 | Good 7.5% |
| Japanese | 78.9 /100 | #146 | Good 7.5% |
| Immigrants | Oceania | 78.4 /100 | #147 | Good 7.5% |
| Immigrants | Brazil | 77.3 /100 | #148 | Good 7.5% |
| Colombians | 76.1 /100 | #149 | Good 7.5% |
| Aleuts | 76.0 /100 | #150 | Good 7.5% |
| Immigrants | Peru | 74.9 /100 | #151 | Good 7.5% |
| Bangladeshis | 74.8 /100 | #152 | Good 7.5% |
| Uruguayans | 74.7 /100 | #153 | Good 7.5% |
| Northern Europeans | 74.3 /100 | #154 | Good 7.5% |
| South Americans | 74.1 /100 | #155 | Good 7.5% |
| Immigrants | Southern Europe | 73.2 /100 | #156 | Good 7.5% |
| Peruvians | 72.3 /100 | #157 | Good 7.5% |
| Croatians | 71.9 /100 | #158 | Good 7.5% |
| Immigrants | Philippines | 71.3 /100 | #159 | Good 7.5% |
Demographics Similar to Danes by Unemployment Among Women with Children Under 6 years
In terms of unemployment among women with children under 6 years, the demographic groups most similar to Danes are Immigrants from Spain (7.1%, a difference of 0.060%), Immigrants from Denmark (7.1%, a difference of 0.12%), Albanian (7.2%, a difference of 0.14%), Immigrants from Hungary (7.1%, a difference of 0.16%), and Alsatian (7.1%, a difference of 0.28%).
| Demographics | Rating | Rank | Unemployment Among Women with Children Under 6 years |
| Immigrants | Albania | 98.7 /100 | #84 | Exceptional 7.1% |
| Immigrants | Romania | 98.7 /100 | #85 | Exceptional 7.1% |
| Immigrants | Zimbabwe | 98.6 /100 | #86 | Exceptional 7.1% |
| Alsatians | 98.4 /100 | #87 | Exceptional 7.1% |
| Immigrants | Hungary | 98.3 /100 | #88 | Exceptional 7.1% |
| Immigrants | Denmark | 98.3 /100 | #89 | Exceptional 7.1% |
| Immigrants | Spain | 98.2 /100 | #90 | Exceptional 7.1% |
| Danes | 98.2 /100 | #91 | Exceptional 7.1% |
| Albanians | 98.0 /100 | #92 | Exceptional 7.2% |
| New Zealanders | 97.8 /100 | #93 | Exceptional 7.2% |
| Macedonians | 97.7 /100 | #94 | Exceptional 7.2% |
| Romanians | 97.7 /100 | #95 | Exceptional 7.2% |
| Immigrants | Eastern Africa | 97.7 /100 | #96 | Exceptional 7.2% |
| Immigrants | South Eastern Asia | 97.6 /100 | #97 | Exceptional 7.2% |
| Russians | 97.5 /100 | #98 | Exceptional 7.2% |