Bahamian vs Celtic Unemployment Among Ages 20 to 24 years

COMPARE

Bahamian
Race
Ancestry
AfghanAfricanAlaska NativeAlaskan AthabascanAlbanianAleutAlsatianAmericanApacheArabArapahoArgentineanArmenianAssyrian/Chaldean/SyriacAustralianAustrianBahamianBangladeshiBarbadianBasqueBelgianBelizeanBermudanBhutaneseBlackfeetBolivianBrazilianBritishBritish West IndianBulgarianBurmeseCajunCambodianCanadianCape VerdeanCarpatho RusynCentral AmericanCentral American IndianCherokeeCheyenneChickasawChileanChineseChippewaChoctawColombianColvilleComancheCosta RicanCreeCreekCroatianCrowCubanCypriotCzechCzechoslovakianDanishDelawareDominicanDutchDutch West IndianEastern EuropeanEcuadorianEgyptianEnglishEstonianEthiopianEuropeanFijianFilipinoFinnishFrenchFrench American IndianFrench CanadianGermanGerman RussianGhanaianGreekGuamanian/ChamorroGuatemalanGuyaneseHaitianHmongHonduranHopiHoumaHungarianIcelanderIndian (Asian)IndonesianInupiatIranianIraqiIrishIroquoisIsraeliItalianJamaicanJapaneseJordanianKenyanKiowaKoreanLaotianLatvianLebaneseLiberianLithuanianLumbeeLuxembourgerMacedonianMalaysianMalteseMarshalleseMenomineeMexicanMexican American IndianMongolianMoroccanNative HawaiianNavajoNepaleseNew ZealanderNicaraguanNigerianNorthern EuropeanNorwegianOkinawanOsageOttawaPaiutePakistaniPalestinianPanamanianParaguayanPennsylvania GermanPeruvianPimaPolishPortuguesePotawatomiPuebloPuerto RicanPuget Sound SalishRomanianRussianSalvadoranSamoanScandinavianScotch-IrishScottishSeminoleSenegaleseSerbianShoshoneSierra LeoneanSiouxSlavicSlovakSloveneSomaliSouth AfricanSouth AmericanSouth American IndianSoviet UnionSpaniardSpanishSpanish AmericanSpanish American IndianSri LankanSubsaharan AfricanSudaneseSwedishSwissSyrianTaiwaneseThaiTlingit-HaidaTohono O'OdhamTonganTrinidadian and TobagonianTsimshianTurkishU.S. Virgin IslanderUgandanUkrainianUruguayanUteVenezuelanVietnameseWelshWest IndianYakamaYaquiYugoslavianYumanYup'ikZimbabwean
Immigration
NonimmigrantsImmigrantsAfghanistanAfricaAlbaniaArgentinaArmeniaAsiaAustraliaAustriaBahamasBangladeshBarbadosBelarusBelgiumBelizeBoliviaBosnia and HerzegovinaBrazilBulgariaBurma/MyanmarCabo VerdeCambodiaCameroonCanadaCaribbeanCentral AmericaChileChinaColombiaCongoCosta RicaCroatiaCubaCzechoslovakiaDenmarkDominicaDominican RepublicEastern AfricaEastern AsiaEastern EuropeEcuadorEgyptEl SalvadorEnglandEritreaEthiopiaEuropeFijiFranceGermanyGhanaGreeceGrenadaGuatemalaGuyanaHaitiHondurasHong KongHungaryIndiaIndonesiaIranIraqIrelandIsraelItalyJamaicaJapanJordanKazakhstanKenyaKoreaKuwaitLaosLatin AmericaLatviaLebanonLiberiaLithuaniaMalaysiaMexicoMicronesiaMiddle AfricaMoldovaMoroccoNepalNetherlandsNicaraguaNigeriaNorth AmericaNorth MacedoniaNorthern AfricaNorthern EuropeNorwayOceaniaPakistanPanamaPeruPhilippinesPolandPortugalRomaniaRussiaSaudi ArabiaScotlandSenegalSerbiaSierra LeoneSingaporeSomaliaSouth AfricaSouth AmericaSouth Central AsiaSouth Eastern AsiaSouthern EuropeSpainSri LankaSt. Vincent and the GrenadinesSudanSwedenSwitzerlandSyriaTaiwanThailandTrinidad and TobagoTurkeyUgandaUkraineUruguayUzbekistanVenezuelaVietnamWest IndiesWestern AfricaWestern AsiaWestern EuropeYemenZaireZimbabweAzores
Celtic
Race
Ancestry
AfghanAfricanAlaska NativeAlaskan AthabascanAlbanianAleutAlsatianAmericanApacheArabArapahoArgentineanArmenianAssyrian/Chaldean/SyriacAustralianAustrianBangladeshiBarbadianBasqueBelgianBelizeanBermudanBhutaneseBlackfeetBolivianBrazilianBritishBritish West IndianBulgarianBurmeseCajunCambodianCanadianCape VerdeanCarpatho RusynCelticCentral AmericanCentral American IndianCherokeeCheyenneChickasawChileanChineseChippewaChoctawColombianColvilleComancheCosta RicanCreeCreekCroatianCrowCubanCypriotCzechCzechoslovakianDanishDelawareDominicanDutchDutch West IndianEastern EuropeanEcuadorianEgyptianEnglishEstonianEthiopianEuropeanFijianFilipinoFinnishFrenchFrench American IndianFrench CanadianGermanGerman RussianGhanaianGreekGuamanian/ChamorroGuatemalanGuyaneseHaitianHmongHonduranHopiHoumaHungarianIcelanderIndian (Asian)IndonesianInupiatIranianIraqiIrishIroquoisIsraeliItalianJamaicanJapaneseJordanianKenyanKiowaKoreanLaotianLatvianLebaneseLiberianLithuanianLumbeeLuxembourgerMacedonianMalaysianMalteseMarshalleseMenomineeMexicanMexican American IndianMongolianMoroccanNative HawaiianNavajoNepaleseNew ZealanderNicaraguanNigerianNorthern EuropeanNorwegianOkinawanOsageOttawaPaiutePakistaniPalestinianPanamanianParaguayanPennsylvania GermanPeruvianPimaPolishPortuguesePotawatomiPuebloPuerto RicanPuget Sound SalishRomanianRussianSalvadoranSamoanScandinavianScotch-IrishScottishSeminoleSenegaleseSerbianShoshoneSierra LeoneanSiouxSlavicSlovakSloveneSomaliSouth AfricanSouth AmericanSouth American IndianSoviet UnionSpaniardSpanishSpanish AmericanSpanish American IndianSri LankanSubsaharan AfricanSudaneseSwedishSwissSyrianTaiwaneseThaiTlingit-HaidaTohono O'OdhamTonganTrinidadian and TobagonianTsimshianTurkishU.S. Virgin IslanderUgandanUkrainianUruguayanUteVenezuelanVietnameseWelshWest IndianYakamaYaquiYugoslavianYumanYup'ikZimbabwean
Immigration
NonimmigrantsImmigrantsAfghanistanAfricaAlbaniaArgentinaArmeniaAsiaAustraliaAustriaBahamasBangladeshBarbadosBelarusBelgiumBelizeBoliviaBosnia and HerzegovinaBrazilBulgariaBurma/MyanmarCabo VerdeCambodiaCameroonCanadaCaribbeanCentral AmericaChileChinaColombiaCongoCosta RicaCroatiaCubaCzechoslovakiaDenmarkDominicaDominican RepublicEastern AfricaEastern AsiaEastern EuropeEcuadorEgyptEl SalvadorEnglandEritreaEthiopiaEuropeFijiFranceGermanyGhanaGreeceGrenadaGuatemalaGuyanaHaitiHondurasHong KongHungaryIndiaIndonesiaIranIraqIrelandIsraelItalyJamaicaJapanJordanKazakhstanKenyaKoreaKuwaitLaosLatin AmericaLatviaLebanonLiberiaLithuaniaMalaysiaMexicoMicronesiaMiddle AfricaMoldovaMoroccoNepalNetherlandsNicaraguaNigeriaNorth AmericaNorth MacedoniaNorthern AfricaNorthern EuropeNorwayOceaniaPakistanPanamaPeruPhilippinesPolandPortugalRomaniaRussiaSaudi ArabiaScotlandSenegalSerbiaSierra LeoneSingaporeSomaliaSouth AfricaSouth AmericaSouth Central AsiaSouth Eastern AsiaSouthern EuropeSpainSri LankaSt. Vincent and the GrenadinesSudanSwedenSwitzerlandSyriaTaiwanThailandTrinidad and TobagoTurkeyUgandaUkraineUruguayUzbekistanVenezuelaVietnamWest IndiesWestern AfricaWestern AsiaWestern EuropeYemenZaireZimbabweAzores
Unemployment Among Ages 20 to 24 years
Income
Poverty
Unemployment
Labor Participation
Family Structure
Vehicle Availability
Education Level
Disability

Unemployment Among Ages 20 to 24 years Comparison

Bahamians

Celtics

Tragic
Exceptional
11.6%
UNEMPLOYMENT AMONG AGES 20 TO 24 YEARS
0.0/ 100
METRIC RATING
279th/ 347
METRIC RANK
9.9%
UNEMPLOYMENT AMONG AGES 20 TO 24 YEARS
98.9/ 100
METRIC RATING
71st/ 347
METRIC RANK

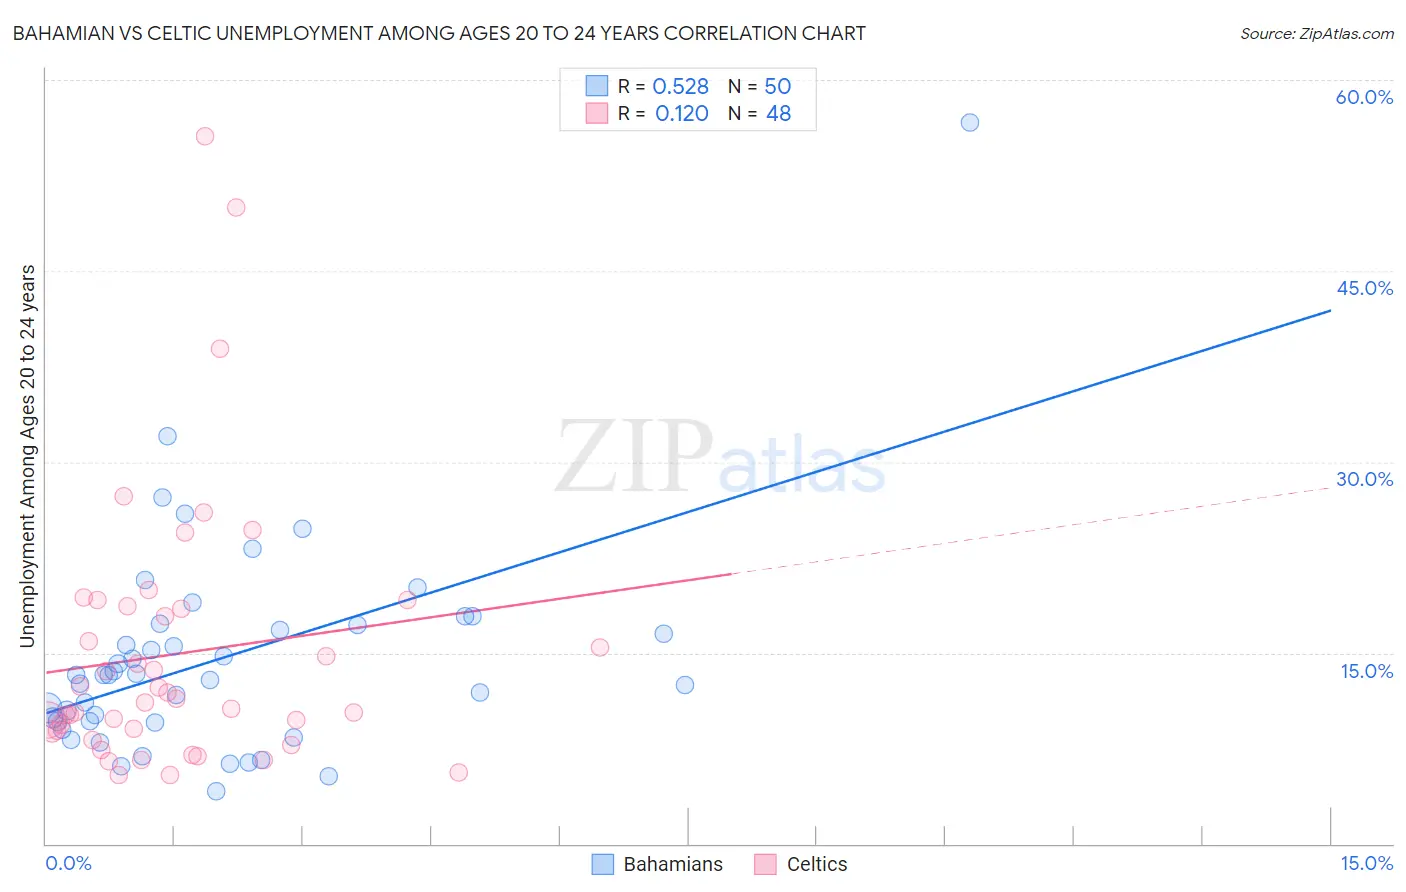
Bahamian vs Celtic Unemployment Among Ages 20 to 24 years Correlation Chart

The statistical analysis conducted on geographies consisting of 111,635,282 people shows a substantial positive correlation between the proportion of Bahamians and unemployment rate among population between the ages 20 and 24 in the United States with a correlation coefficient (R) of 0.528 and weighted average of 11.6%. Similarly, the statistical analysis conducted on geographies consisting of 165,509,552 people shows a poor positive correlation between the proportion of Celtics and unemployment rate among population between the ages 20 and 24 in the United States with a correlation coefficient (R) of 0.120 and weighted average of 9.9%, a difference of 17.2%.
Bahamian vs Celtic Unemployment Among Ages 20 to 24 years

Unemployment Among Ages 20 to 24 years Correlation Summary

MeasurementBahamianCeltic
Minimum4.1%5.4%
Maximum56.7%55.6%
Range52.6%50.2%
Mean14.5%14.9%
Median13.2%11.3%
Interquartile 25% (IQ1)9.6%8.8%
Interquartile 75% (IQ3)17.2%18.6%
Interquartile Range (IQR)7.6%9.7%
Standard Deviation (Sample)8.5%10.5%
Standard Deviation (Population)8.4%10.4%

Similar Demographics by Unemployment Among Ages 20 to 24 years

Demographics Similar to Bahamians by Unemployment Among Ages 20 to 24 years

In terms of unemployment among ages 20 to 24 years, the demographic groups most similar to Bahamians are Colville (11.6%, a difference of 0.25%), African (11.5%, a difference of 0.28%), Alaskan Athabascan (11.6%, a difference of 0.35%), Sierra Leonean (11.5%, a difference of 0.43%), and Senegalese (11.5%, a difference of 0.47%).
DemographicsRating | RankUnemployment Among Ages 20 to 24 years
Nigerians
0.0
/100
|
#272
Tragic
11.4%
Immigrants | Nigeria
0.0
/100
|
#273
Tragic
11.5%
Cape Verdeans
0.0
/100
|
#274
Tragic
11.5%
Senegalese
0.0
/100
|
#275
Tragic
11.5%
Sierra Leoneans
0.0
/100
|
#276
Tragic
11.5%
Africans
0.0
/100
|
#277
Tragic
11.5%
Colville
0.0
/100
|
#278
Tragic
11.6%
Bahamians
0.0
/100
|
#279
Tragic
11.6%
Alaskan Athabascans
0.0
/100
|
#280
Tragic
11.6%
Armenians
0.0
/100
|
#281
Tragic
11.7%
Immigrants | Cameroon
0.0
/100
|
#282
Tragic
11.7%
Ghanaians
0.0
/100
|
#283
Tragic
11.7%
Immigrants | Western Africa
0.0
/100
|
#284
Tragic
11.7%
Soviet Union
0.0
/100
|
#285
Tragic
11.7%
Ecuadorians
0.0
/100
|
#286
Tragic
11.8%

Demographics Similar to Celtics by Unemployment Among Ages 20 to 24 years

In terms of unemployment among ages 20 to 24 years, the demographic groups most similar to Celtics are Immigrants from Croatia (9.9%, a difference of 0.030%), Bolivian (9.9%, a difference of 0.040%), Bulgarian (9.9%, a difference of 0.15%), Kenyan (9.9%, a difference of 0.18%), and Immigrants from Laos (9.9%, a difference of 0.21%).
DemographicsRating | RankUnemployment Among Ages 20 to 24 years
Serbians
99.4
/100
|
#64
Exceptional
9.8%
Welsh
99.3
/100
|
#65
Exceptional
9.8%
Scottish
99.3
/100
|
#66
Exceptional
9.8%
Immigrants | Bolivia
99.2
/100
|
#67
Exceptional
9.9%
Mongolians
99.1
/100
|
#68
Exceptional
9.9%
Bulgarians
99.1
/100
|
#69
Exceptional
9.9%
Immigrants | Croatia
99.0
/100
|
#70
Exceptional
9.9%
Celtics
98.9
/100
|
#71
Exceptional
9.9%
Bolivians
98.9
/100
|
#72
Exceptional
9.9%
Kenyans
98.7
/100
|
#73
Exceptional
9.9%
Immigrants | Laos
98.7
/100
|
#74
Exceptional
9.9%
Immigrants | Australia
98.6
/100
|
#75
Exceptional
9.9%
Czechoslovakians
98.4
/100
|
#76
Exceptional
9.9%
Chickasaw
98.4
/100
|
#77
Exceptional
9.9%
Assyrians/Chaldeans/Syriacs
98.3
/100
|
#78
Exceptional
9.9%