Immigrants from South America vs Celtic Unemployment Among Ages 20 to 24 years
COMPARE
Immigrants from South America
Celtic
Unemployment Among Ages 20 to 24 years
Unemployment Among Ages 20 to 24 years Comparison
Immigrants from South America
Celtics
10.6%
UNEMPLOYMENT AMONG AGES 20 TO 24 YEARS
5.1/ 100
METRIC RATING
225th/ 347
METRIC RANK
9.9%
UNEMPLOYMENT AMONG AGES 20 TO 24 YEARS
98.9/ 100
METRIC RATING
71st/ 347
METRIC RANK
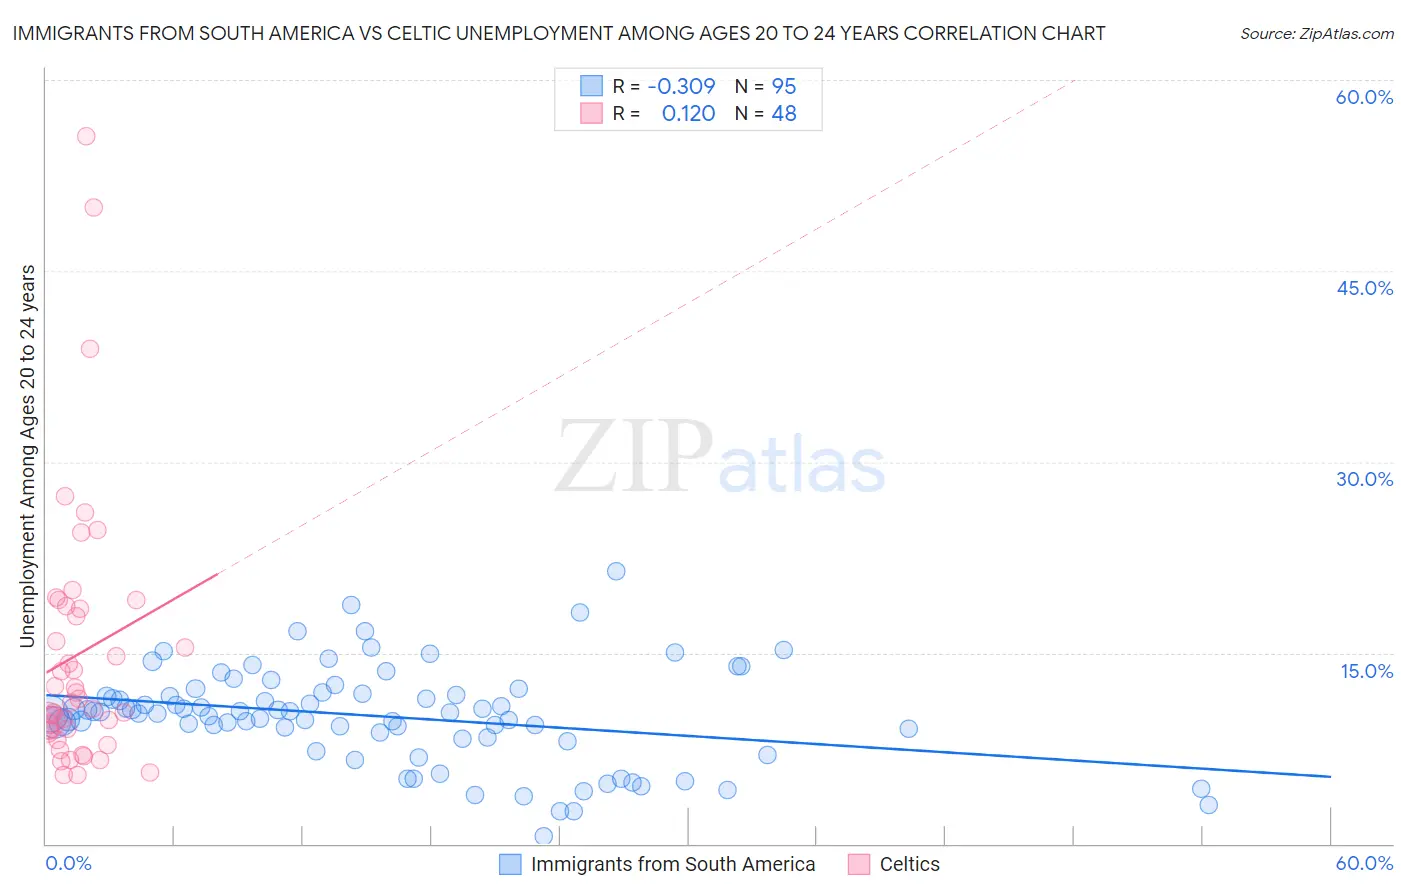
Immigrants from South America vs Celtic Unemployment Among Ages 20 to 24 years Correlation Chart
The statistical analysis conducted on geographies consisting of 465,340,775 people shows a mild negative correlation between the proportion of Immigrants from South America and unemployment rate among population between the ages 20 and 24 in the United States with a correlation coefficient (R) of -0.309 and weighted average of 10.6%. Similarly, the statistical analysis conducted on geographies consisting of 165,509,552 people shows a poor positive correlation between the proportion of Celtics and unemployment rate among population between the ages 20 and 24 in the United States with a correlation coefficient (R) of 0.120 and weighted average of 9.9%, a difference of 7.1%.
Unemployment Among Ages 20 to 24 years Correlation Summary
| Measurement | Immigrants from South America | Celtic |
| Minimum | 0.60% | 5.4% |
| Maximum | 21.4% | 55.6% |
| Range | 20.8% | 50.2% |
| Mean | 10.0% | 14.9% |
| Median | 10.3% | 11.3% |
| Interquartile 25% (IQ1) | 8.3% | 8.8% |
| Interquartile 75% (IQ3) | 11.8% | 18.6% |
| Interquartile Range (IQR) | 3.5% | 9.7% |
| Standard Deviation (Sample) | 3.8% | 10.5% |
| Standard Deviation (Population) | 3.8% | 10.4% |
Similar Demographics by Unemployment Among Ages 20 to 24 years
Demographics Similar to Immigrants from South America by Unemployment Among Ages 20 to 24 years
In terms of unemployment among ages 20 to 24 years, the demographic groups most similar to Immigrants from South America are Nepalese (10.6%, a difference of 0.010%), Immigrants from Costa Rica (10.6%, a difference of 0.030%), Palestinian (10.6%, a difference of 0.030%), Arab (10.6%, a difference of 0.10%), and Mexican American Indian (10.6%, a difference of 0.10%).
| Demographics | Rating | Rank | Unemployment Among Ages 20 to 24 years |
| Immigrants | Nonimmigrants | 8.8 /100 | #218 | Tragic 10.5% |
| Immigrants | Southern Europe | 8.0 /100 | #219 | Tragic 10.5% |
| Eastern Europeans | 6.9 /100 | #220 | Tragic 10.6% |
| Central Americans | 6.8 /100 | #221 | Tragic 10.6% |
| Immigrants | Poland | 6.4 /100 | #222 | Tragic 10.6% |
| Arabs | 5.6 /100 | #223 | Tragic 10.6% |
| Nepalese | 5.1 /100 | #224 | Tragic 10.6% |
| Immigrants | South America | 5.1 /100 | #225 | Tragic 10.6% |
| Immigrants | Costa Rica | 4.9 /100 | #226 | Tragic 10.6% |
| Palestinians | 4.9 /100 | #227 | Tragic 10.6% |
| Mexican American Indians | 4.6 /100 | #228 | Tragic 10.6% |
| Americans | 4.4 /100 | #229 | Tragic 10.6% |
| French American Indians | 4.1 /100 | #230 | Tragic 10.6% |
| Native Hawaiians | 3.9 /100 | #231 | Tragic 10.6% |
| Israelis | 3.7 /100 | #232 | Tragic 10.6% |
Demographics Similar to Celtics by Unemployment Among Ages 20 to 24 years
In terms of unemployment among ages 20 to 24 years, the demographic groups most similar to Celtics are Immigrants from Croatia (9.9%, a difference of 0.030%), Bolivian (9.9%, a difference of 0.040%), Bulgarian (9.9%, a difference of 0.15%), Kenyan (9.9%, a difference of 0.18%), and Immigrants from Laos (9.9%, a difference of 0.21%).
| Demographics | Rating | Rank | Unemployment Among Ages 20 to 24 years |
| Serbians | 99.4 /100 | #64 | Exceptional 9.8% |
| Welsh | 99.3 /100 | #65 | Exceptional 9.8% |
| Scottish | 99.3 /100 | #66 | Exceptional 9.8% |
| Immigrants | Bolivia | 99.2 /100 | #67 | Exceptional 9.9% |
| Mongolians | 99.1 /100 | #68 | Exceptional 9.9% |
| Bulgarians | 99.1 /100 | #69 | Exceptional 9.9% |
| Immigrants | Croatia | 99.0 /100 | #70 | Exceptional 9.9% |
| Celtics | 98.9 /100 | #71 | Exceptional 9.9% |
| Bolivians | 98.9 /100 | #72 | Exceptional 9.9% |
| Kenyans | 98.7 /100 | #73 | Exceptional 9.9% |
| Immigrants | Laos | 98.7 /100 | #74 | Exceptional 9.9% |
| Immigrants | Australia | 98.6 /100 | #75 | Exceptional 9.9% |
| Czechoslovakians | 98.4 /100 | #76 | Exceptional 9.9% |
| Chickasaw | 98.4 /100 | #77 | Exceptional 9.9% |
| Assyrians/Chaldeans/Syriacs | 98.3 /100 | #78 | Exceptional 9.9% |